Visualize Hierarchical Tree Structures Using D3.js – d3-mitch-tree
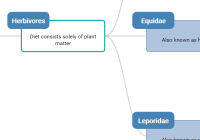
The d3-mitch-tree JavaScript library lets you render an interactive diagram from JS objects/arrays to visualize the hierarchical tree structures in an elegant way.


The d3-mitch-tree JavaScript library lets you render an interactive diagram from JS objects/arrays to visualize the hierarchical tree structures in an elegant way.

CSS only bar and scatter plot graphs with graceful fallback support for mobile devices.

circleDonutChart is a standalone JS library for drawing animated, flexible and flat styled donut charts using SVG objects.

The NiceChart.js library lets you create customizable, scalable, SVG-based charts & graphs on the web app.

A powerful tikzcd visual editor that allows you to draw commutative diagrams and other kinds of mathematical pictures.

Smoothie is a vanilla JavaScript chart library which can be used to visualize real-time data streams with smooth animations using HTML5 canvas API.

flowcharty is a JavaScript library that makes uses of d3.js to dynamically generate SVG flowchart to represent your algorithm, workflow or process.

asciichart is a funny JavaScript chart library which helps you render a chart of plotted data using ASCII Art text.

The Treeflex CSS library lets you create a flexible, semantic, SEO-friendly hierarchy tree from nested HTML lists.
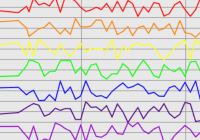
SensorChart is a simple, fast JavaScript library that renders an animated chart to visualize real-time streaming data (e.g. fps) using Canvas and WebGL (Web Graphics Library) API.