Hand-drawn Style SVG Chart Library – chart.xkcd

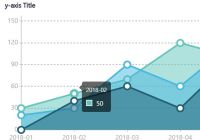
chart.xkcd is a JavaScript plotting library for drawing XKCD-style hand-drawn charts using SVG and plain JavaScript.


chart.xkcd is a JavaScript plotting library for drawing XKCD-style hand-drawn charts using SVG and plain JavaScript.

SVG Gauge is a dependency-free JavaScript library for drawing customizable, animated gauges using JavaScript and SVG.

Circos.js is a JavaScript graph library to visualizes data in a circular layout that is great for exploring relationships between objects or positions.

A JavaScript chart library that renders candlestick charts with technical indicators to describe price movements/trends of a security, derivative, or currency.

dailyChart is a JavaScript chart library which uses SVG element to render a dynamic, fully configurable line chart/graph for the stock market.

A lightweight web component that helps developer dynamically render an SVG based Gantt chart to visualize tasks defined in a JavaScript object.

EZgraph is a simple plain JavaScript chart library to render animated, responsive, zoomable charts and graphs with no dependency.
dopyo.js is a lightweight JavaScript library for dynamically rendering beautiful, scalable, SVG based charts from a data set you provide.

VexChords is a Chord Chart generator which helps you dynamically render guitar chords using JavaScript and SVG element.

Circles.js is a vanilla JavaScript plugin used to draw animated, mobile-friendly circles from a given angle or percentage value using Canvas.