Responsive CSS Chart Library For Web – Neo Charts

A zero-dependency chart library that creates responsive column, bar, line, gauge, heatmap, and treemap charts with no SVG or no Canvas required.


A zero-dependency chart library that creates responsive column, bar, line, gauge, heatmap, and treemap charts with no SVG or no Canvas required.

Create bar, line, and pie charts with pure JavaScript. Beaned-Charts delivers responsive SVG visualizations with no framework requirements.
Build smooth, GPU-accelerated charts with ChartGPU. This library handles millions of data points and real-time updates. Native TypeScript support.

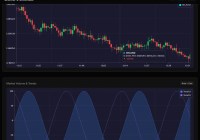
A zero-dependency JavaScript library for high-performance financial and economic charts. Supports technical indicators, recessions, and logarithmic scales.

A lightweight, dependency-free JavaScript library for creating simple bar charts using HTML5 Canvas. Configure and render easily.

A lightweight JavaScript library for basic charts. Create bar, line, and pie charts quickly.

A JavaScript library for drawing a stacked horizontal/vertical bar chart with time-series data on an HTML canvas element, which can be used to show changes in data over time.

A lightweight JavaScript library to generate Segmented Horizontal Bar Graphs from an array of JS objects.

A tiny JavaScript library that lets you draw animated bar/column, pie/donut, and line area charts from one or more datasets.

A tiny JavaScript library for generating a segmented (stepped) horizontal bar chart (progress bar).