


vector-charts is a lightweight, reusable, customizable, scalable (SVG) charting library based on D3.js.
Chart Types:
- Line Chart
- Area Chart
- Line + Area Chart
- Stacked Area Chart
- Line + Stacked Area Chart
- Pie Chart
- Donut Chart
- Bar Chart
- Multi series Bar Chart
Basic Usage:
1. Download the package and load the necessary JavaScript & CSS files:
<!-- Stylesheet -->
<link rel="stylesheet" href="vector-charts.css" />
<!-- All In One -->
<script src="vector-charts.min.js"></script>

<!-- Import Modules On Demand -->
<script src="vector-charts-lazy.min.js"></script>
<!-- Or A Specific Module You Find Under The DIST folder -->
<script src="barseries.min.js"></script>
...
2. Insert an empty SVG element into the chart container.
<div id="container" class="chart">
  <svg>
  </svg>
</div>
3. The JavaScript to render a line chart.

const opts = {
  chart: {
      heading: "Timeseries",
      chartIndex: 2,
      height: 270,
      margin: {
          top: 40,
          right: 15,
          bottom: 50,
          left: 15
      },
      chartResize: true,
      chartType: "timeseries",
      isTouchScreen: !!(navigator.maxTouchPoints || ("ontouchstart" in window))
  },
  data: jdata,
  yAxis: {
      left: {
          unit: 'Count',
          tickNumber: 5,
          formadt(d) { // Format all series belong to this Y Axis
              return d
          }
      }
  },
  zoom: {
      visible: true,
      onXZoom() {
          console.log('im x zoom')
      }
  },
  series: {
      line: [{
          name: 'Series-A',
          color: "#386CB0",
          lineWidth: '2px',
          plotAxis: ["left", "bottom"]
      }, {
          name: 'Series-B',
          color: "#666699",
          lineWidth: '2px',
          plotAxis: ["left", "bottom"]
      }, {
          name: 'Series-C',
          color: "#368669",
          lineWidth: '2px',
          plotAxis: ["left", "bottom"]
      }]
  }
};
vc.plotChart('#container', opts).then(chart => myChart = chart)
4. Render the time series data as an area chart.

const opts = {
chart: {
heading: "Timeseries",
chartIndex: 2,
height: 270,
margin: {
top: 40,
right: 15,
bottom: 50,
left: 15
},
chartResize: true,
chartType: "timeseries"
},
data: jdata,
xAxis: {
bottom: {
label: 'Time',
tickNumber: 5,
}
},
yAxis: {
left: {
unit: 'Count',
tickNumber: 5,
label: 'Count',
format(d) { // Format all series belong to this Y Axis
return d
}
}
},
zoom: {
visible: true,
onXZoom(st, et) {
console.log('im x zoom', st, et)
}
},
series: {
stack: [{
name: 'StackGroup', // Name of stack
plotAxis: ["left", "bottom"], // Define its axis dependency for all below defined series
stackOrderMembers: [{
name: 'Series-A',
color: "#990506",
}]
}]
}
};
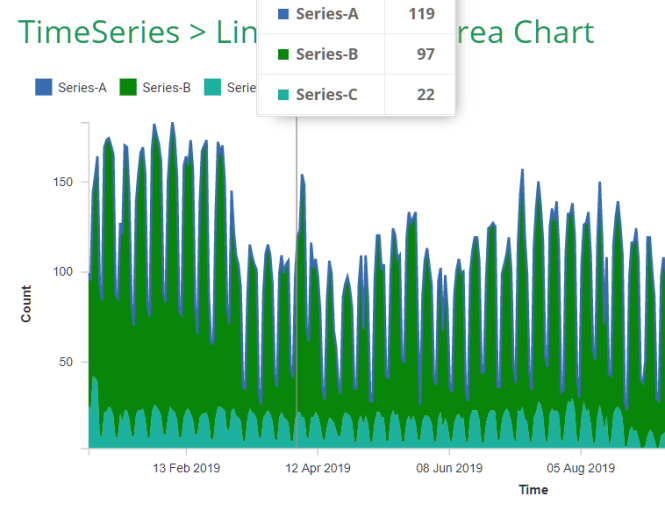
vc.plotChart('#container', opts).then(chart => myChart = chart)5. Render the time series data as a line + area chart.

const opts = {
  chart: {
    heading: "Timeseries",
    chartIndex: 2,
    height: 270,
    margin: {
      top: 40,
      right: 15,
      bottom: 50,
      left: 15
    },
    chartResize: true,
    chartType: "timeseries"
  },
  data: jdata,
  xAxis: {
    bottom: {
      label: 'Time',
      tickNumber: 5,
    }
  },
  yAxis: {
    left: {
      unit: 'Count',
      tickNumber: 5,
      label: 'Count',
      format(d) { // Format all series belong to this Y Axis
        return d
      }
    }
  },
  zoom: {
    visible: true,
    onXZoom(st, et) {
      console.log('im x zoom', st, et)
    }
  },
  series: {
    line: [{
      name: 'Series-A',
      color: "#386CB0",
      lineWidth: '2px',
      plotAxis: ["left", "bottom"]
    }],
    stack: [{
      name: 'StackGroup', // Name of stack
      plotAxis: ["left", "bottom"], // Define its axis dependency for all below defined series
      stackOrderMembers: [{
        name: 'Series-B',
        color: "#990506",
      }]
    }]
  }
};
vc.plotChart('#container', opts).then(chart => myChart = chart)
6. Render the time series data as a stacked area chart.

const opts = {
  chart: {
    heading: "Timeseries",
    chartIndex: 2,
    height: 270,
    margin: {
      top: 40,
      right: 15,
      bottom: 50,
      left: 15
    },
    chartResize: true,
    chartType: "timeseries"
  },
  data: jdata,
  xAxis: {
    bottom: {
      label: 'Time',
      tickNumber: 5,
    }
  },
  yAxis: {
    left: {
      unit: 'Count',
      tickNumber: 5,
      label: 'Count',
      format(d) { // Format all series belong to this Y Axis
        return d
      }
    }
  },
  zoom: {
    visible: true,
    onXZoom(st, et) {
      console.log('im x zoom', st, et)
    }
  },
  series: {
    stack: [{
      name: 'StackGroup', // Name of stack
      plotAxis: ["left", "bottom"], // Define its axis dependency for all below defined series
      stackOrderMembers: [{
        name: 'Series-C',
        color:"#1cb09f",
      }, {
        name: 'Series-B',
        color:"#078609",
      }, {
        name: 'Series-A',
        color:"#990506",
      }]
    }]
  }
};
vc.plotChart('#container', opts).then(chart => myChart = chart)
7. Render the time series data as a line+ stacked area chart.
const opts = {
  chart: {
    heading: "Timeseries",
    chartIndex: 2,
    height: 270,
    margin: {
      top: 40,
      right: 15,
      bottom: 50,
      left: 15
    },
    chartResize: true,
    chartType: "timeseries"
  },
  data: jdata,
  xAxis: {
    bottom: {
      label: 'Time',
      tickNumber: 5,
    }
  },
  yAxis: {
    left: {
      unit: 'Count',
      tickNumber: 5,
      label: 'Count',
      format(d) { // Format all series belong to this Y Axis
        return d
      }
    }
  },
  zoom: {
    visible: true,
    onXZoom(st, et) {
      console.log('im x zoom', st, et)
    }
  },
  series: {
    line: [{
      name: 'Series-A',
      color: "#386CB0",
      lineWidth: '2px',
      plotAxis: ["left", "bottom"]
    }],
    stack: [{
      name: 'StackGroup', // Name of stack
      plotAxis: ["left", "bottom"], // Define its axis dependency for all below defined series
      stackOrderMembers: [{
        name: 'Series-C',
        color:"#1cb09f",
      }, {
        name: 'Series-B',
        color:"#078609",
      }]
    }]
  }
};
vc.plotChart('#container', opts).then(chart => myChart = chart)
8. Generate a pie chart.

const opts = {
  chart: {
    heading: "Pieseries",
    chartIndex: 2,
    height: 270,
    margin: {
      top: 40,
      right: 15,
      bottom: 50,
      left: 15
    },
    chartResize: true,
    chartType: "pieseries"
  },
  data: jdata,
  series: {
    pie: {
      name: 'PieChart',
      visible: true,
      unit: 'Count'
    }
  }
};
vc.plotChart('#container', opts).then(chart => myChart = chart)
9. Generate a donut chart.

const opts = {
  chart: {
    heading: "Pieseries",
    chartIndex: 2,
    height: 270,
    margin: {
      top: 40,
      right: 15,
      bottom: 50,
      left: 15
    },
    chartResize: true,
    chartType: "pieseries"
  },
  data: jdata,
  series: {
    pie: {
      name: 'PieChart',
      visible: true,
      unit: 'Count',
      donutPercent: 40 // Specify percent to show donut ring
    }
  }
};
vc.plotChart('#container', opts).then(chart => myChart = chart)
10. Generate a bar (column) chart.

const opts = {
  chart: {
    heading: "Barseries",
    chartIndex: 2,
    //width: 800,
    height: 270,
    margin: {
      top: 40,
      right: 15,
      bottom: 50,
      left: 15
    },
    chartResize: true,
    chartType: "barseries"
  },
  data: jdata,
  xAxis: {
    bottom: {
      rotateText: "slant",
      scalePadding: 0.3,
      scaleType: "scaleBand",
      textLimit: 10,
      tickNumber: 5,
      unit: "Names"
    }
  },
  yAxis: {
    left: {
      unit: 'Count',
      tickNumber: 5,
    }
  },
  zoom: {
    visible: false
  },
  series: {
    bar: [{
      barOrderMembers: [{
        color: "#1d8378",
        name: "Count"
      }],
      name: "Bar_Chart",
      plotAxis: ["left", "bottom"],
      events: {
        click: function(dtArr, dtPos) {
          console.log(dtArr, dtPos)
        }
      }
    }],
    stack: []
  }
};
vc.plotChart('#container', opts).then(chart => myChart = chart)
11. Create a Multi Series Bar Chart.

const opts = {
  chart: {
    heading: "Barseries",
    chartIndex: 2,
    height: 270,
    margin: {
      top: 40,
      right: 15,
      bottom: 50,
      left: 15
    },
    chartResize: true,
    chartType: "barseries"
  },
  data: jdata,
  xAxis: {
    bottom: {
      rotateText: "slant",
      scalePadding: 0.3,
      scaleType: "scaleBand",
      textLimit: 10,
      tickNumber: 5,
      unit: "Names"
    }
  },
  yAxis: {
    left: {
      unit: 'Count',
      tickNumber: 5,
    }
  },
  zoom: {
    visible: false
  },
  series: {
    bar: [{
      barOrderMembers: [{
        color: "#1d8378",
        name: "Count"
      }, {
        color: "#cbffea",
        name: "Count 2"
      }],
      name: "Bar_Chart",
      plotAxis: ["left", "bottom"],
      events: {
        click: function(dtArr, dtPos) {
          console.log(dtArr, dtPos)
        }
      }
    }],
    stack: []
  }
};
vc.plotChart('#container', opts).then(chart => myChart = chart)
Changelog:
08/13/2020
- Added dots in line chart
08/07/2020
- v1.0.0
See Also:
 Versatile Radial Menu In Pure CSS – radialMenu.css
 Compose And Visualize Points In Spaces – Pts.js
 Animate Text Using SVG Font – svg-text-animate.js
 Lightweight And Flexible Modal Window In Pure JavaScript – hystModal
 Create Modern Glassmorphism Interfaces with Liquid Glass CSS Framework
 Create Stylish, Customizable Toasts With The toast-cg Library
 Create Dynamic Particle Effects with Particulab JavaScript Library
 Minimalist Vertical Timeline With Pure CSS – Timelined