


EZgraph is a simple plain JavaScript chart library to render animated, responsive, zoomable charts and graphs with no dependency.
The charts are generated using plain JavaScript and CSS. No SVG and Canvas needed.
Supported chart types:
- Bar/column chart
- Bubble chart
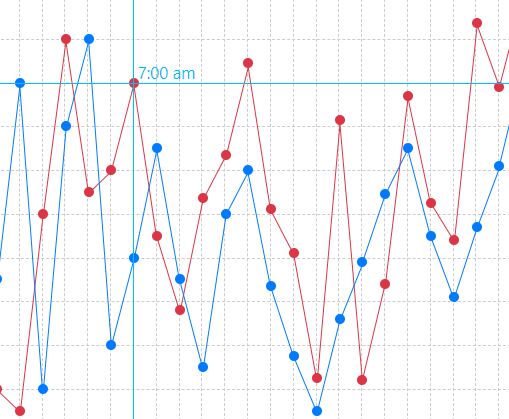
- Line graph
- Pie chart
- Scatter plot chart
- Timeline
How to use it:
To use the chart library, load the following JavaScript and CSS files in the project.
<link rel="stylesheet" href="EZgraph.css">
<script src="EZgraph.js"></script>
Prepare your data set as follows:
Const myData = {
      "Data Set 3": {
        color: "orange",
        values: [
          25,34,55,15,90
        ]
      },
      "Data Set 2": {
        color: "#dc3545",
        values: [
          10,70,80,90,30
        ]
      },
      "Data Set 1": {
        color: "#007bff",
        values: [
          19,24,43,77,38
        ]
      }
}
Render a basic bar/column chart from the data set you provide.
let barGraph = new EZgraph({
    container: document.getElementById("yourContainerID"),
    type: "bar",
    title: "Bar Graph",
    minValue: 0,
    maxValue: 100,
    height: 350,
    width: 420,
    categories: ['Jan','Feb','Mar','Apr','May'],
    intervals: 10,
    xLabel: "",
    yLabel: "",
    graphKeyTitle: "Data Sets",
    animate: "oneByOne",
    hideValues: false,
    hideIntervalGuides:false,
    hideValueGuides: false,
    data: myData
});
Generate a custom chart with the following settings:
let myChart = new EZgraph({

    // chart type:
    // 'bar', 'timeline', 'line', 'bubble', 'scatter', 'pie'
    type : false,

    // the target container in which the library renders the chart
    container : false,
    // width
    width : 200,
    // height
    height : 200,
    // size
    size : 200,
    // intervals
    intervals : 1,
    xIntervals : 1,
    yIntervals : 1,
    // min/max values
    minXValue : 0,
    maxXValue : 100,
    minYValue : 0,
    maxYValue : 100,
    minValue : 0,
    maxValue : 100,
    // categories
    categories : [],
    // chart title
    title : "",
    // x/y axis labels
    xLabel : "",
    yLabel : "",
    // hides interval guides
    hideIntervalGuides : false,
    // hide guides
    hideValueGuides : false,
    // hide values
    hideValues : false,
    // extra CSS styles
    graphStyle : {},
    // hides graph key
    hideGraphKey : false,
    // graph key title
    graphKeyTitle : "Graph Key",
    // enables animations
    animate : false,
    // enables trend line
    trendLine : false,
    // your data set
    data : false,
    // or 'horizontal'
    orientation : false,
    // connects between points
    connected : false,
}),
More Previews:

EZgraph Pie Chart

EZgraph Scatter Plot Chart

EZgraph Horizontal Bar Chart

EZgraph Line Graph
EZgraph Timeline

EZgraph Bar Graph

EZgraph Bubble Graph
See Also:
 Collapsible Side Table Of Contents In JavaScript – DocumentOutline
 Toast-style Temporary Notification Library – ice-toast
 Compare Two Images With Range Input
 Modern Retina-ready Image Lazy Loader – lazyestload.js
 Detect Faces In An Image Using JavaScript And Canvas – facedetector.js
 Vanilla Growl Notification JavaScript Library – VYN
 Nice Clean Tabs Component Using Pure HTML / CSS
 iOS Style Switches For Bootstrap 4 – Custom Switch