


ProgressJS is a progress bar JavaScript library that helps you create customizable, animated, circular progress bars on your web apps.
It’s ideal for visualizing loading progress, task completion, or any other type of data that can be represented as a percentage.
How to use it:
1. Download the package and load the main script progress.js on your HTML page.
<script src="/build/progress.min.js"></script>
2. Create an empty DIV container for the progress bar.
<div class="progress-js"></div>
3. You can then customize the progress bar by adding various data attributes to the <div> element, such as width, height, stroke width, foreground color, background color, font size, font weight, duration, starting value, overall value, suffix, and shadow. For example:
<div
  class="progress-js"
  data-width="100"
  data-height="100"
  data-stroke-width="10"
  data-value="0"
  data-font-size="1rem"
  data-font-weight="900"
  data-fgColor="#757AAE"
  bgColor="#CCCCCC"
  duration="2s"
  overall="100"
  suffix="%"
  shadow="false">
</div>
4. Update the date manually.
progressJs.update('progress-js-1', 90);See Also:
 Pure CSS Progress Bar Library with Custom Themes – progress-bar.css
 Modern TypeScript Progress Bar Library – BProgress
 3D Liquid Progress Bar in Pure CSS/CSS3
 Easy Scroll Position Tracking – ScrollProgress.js
 Radial Progress Indicator For Click-and-hold Actions – HoldCircleJS
 Simple Scroll Progress Indicator For Long Pages – PageBar.js
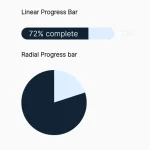 Generate Linear & Radial Progressbars Using CSS – Progress.css
 Lightweight Scroll Progress Bar In JavaScript – scrollProgress.js