


DojiChart is a pure JavaScript chart library that renders responsive and customizable candlestick charts with technical indicators for financial websites to describe price movements/trends of a security, derivative, or currency.
Basic usage:
Install and download the package.
# NPM
$ npm install dojichart --save
Include the dojichart.min.js and dojichart.min.css on the webpage.
<link rel="stylesheet" href="dojichart.min.css" />
<script src="dojichart.min.js"></script>
Or load the necessary files from a CDN.
<link rel="stylesheet" href="https://cdn.jsdelivr.net/npm/dojichart@latest/dist/dojichart.min.css" />
<script src="https://cdn.jsdelivr.net/npm/dojichart@latest/dist/dojichart.min.js"></script>
Insert regions to the DojiChart container.
<div class="dojichart" id="myChart">
  <div class="region" data-name="timelabels"></div>
  <div class="region" data-name="price"></div>
  <div class="region" data-name="volume"></div>
</div>
Initialize the DojiChart instance with options.
var dojichart = new DojiChart.core.Chart(document.getElementById("myChart"), {
    fieldMap: {
      time: "time",
      open: "openBid",
      high: "highBid",
      low: "lowBid",
      close: "closeBid",
      volume: "volume"
    },
    crosshair: true
});
Create panels and add components to the chart based on the data-name attribute.
// Candlestick layer
var candle_layer = new DojiChart.layer.CandleLayer({});
// Price chart panel
var price_chart_panel = new DojiChart.panel.TimeValuePanel({
  primaryLayer: candle_layer,
  height: 250,
  grid: true
});
dojichart.addComponent("price", price_chart_panel);
// Moving average
var sma_layer = new DojiChart.layer.indicator.SimpleMovingAverageLayer({
  period: 50
});
price_chart_panel.addLayer(sma_layer);
// Time labels (at top of chart)
var time_labels_panel = new DojiChart.panel.TimeLabelsPanel();
dojichart.addComponent("timelabels", time_labels_panel);
// Volume
var volume_layer = new DojiChart.layer.indicator.VolumeLayer({
  barColor: "#3377FF",
  barWidth: 5
});
var volume_chart_panel = new DojiChart.panel.TimeValuePanel({
  height: 100,
  primaryLayer: volume_layer
});
dojichart.addComponent("volume", volume_chart_panel);
Load data you specify.
dojichart.loadData(raw_data, symbol, granularity, do_draw);
All possible options to customize the candlestick chart.
See Also:
 Intuitive Charting Library for Financial Data – DXCharts Lite
 Customizable Pure JavaScript Calendar Library – jsCalendar
 Implement Native Sharing Buttons With Ease – share-button
 Sliding Hamburger Navigation With GSAP
 Create Collapsible Elements With Lux Toggle
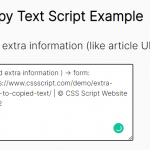 Add Extra Information To Copied Content – Copy Text Script
 Pure CSS/CSS3 Off-screen Side Navigation
 Moder Pure CSS Tooltip Library – Cooltipz.css