Tiny Customizable SVG Line Chart Library – oi.linechart.js

A lightweight JavaScript library for drawing customizable SVG line charts on the page.


A lightweight JavaScript library for drawing customizable SVG line charts on the page.

A simple, lightweight, interactive gantt chart where the users are able to add, edit, expand, collapse schedules on the client side.

Frappé Charts is a pure JavaScript library to render modern, responsive, animated charts with various types using SVG element.

Using a single div and some CSS you can build circle diagrams representing percentage values.

A tool that helps quickly generate a horizontal timeline from JSON to visualize data over time.

js2flowchart is a pure JavaScript library used to dynamically render JS code flowchart diagrams using SVG.
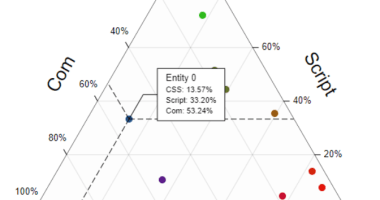
A JavaScript library that enables you to draw a customizable Triangle Graph on an HTML5 canvas to display multivariate data.
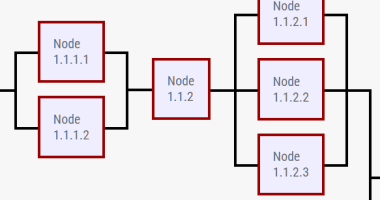
A Pure CSS library to render a Process Flow Diagram illustrating the relationships between nodes defined in nested HTML lists.
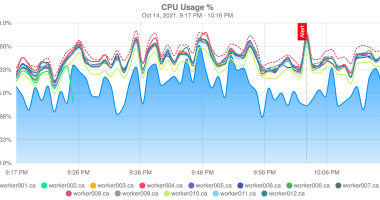
A lightweight, high-performance, retina-ready JavaScript charting library for drawing time series charts on an HTML5 canvas element.

A pure JavaScript knob component to render canvas-based, highly customizable knobs/dials/gauges on the web app.