


An alternative to pie charts when you want a multi-sided visualization.
TriangularGraph is a JavaScript library that enables you to draw a customizable Triangle Graph on an HTML5 canvas to display multivariate data.
How to use it:
1. Download and import the TriangularGraph.
import TriangularGraph from './build/TriangularGraph.js'
2. Create a container in which the library draws the canvas.
<div class="graph"></div>
3. Initialize the TriangularGraph and define your data to be visualized in multiple dimensions.
const graph = new TriangularGraph(".graph", {
      data: [
        {
        coordinate: [0.5, 0.6, 0.7],
        dotColor: "rgb(150,30,74)"
        title: "Title 1"
        },
        {
        coordinate: [0.5, 0.6, 0.7],
        dotColor: "rgb(150,30,74)"
        title: "Title 2"
        },
        {
        coordinate: [0.5, 0.6, 0.7],
        dotColor: "rgb(150,30,74)"
        title: "Title 3"
        },
        // ...
      ]
})
4. Possible options to customize the Triangle Graph.
const graph = new TriangularGraph(".graph", {
      // width/height in px
      width: 960,
      height: 640,
      // graph title
      title: {
        text: "Graph Title"
      },
      // sub-title
      subtitle: {
        text: `Sub Title`
      },
      // axis options
      axis: {
        titles: [
          {
              text: 'Axis 1'
          },
          {
              text: 'Axis 2'
          },
          {
              text: 'Axis 3'
          }
        ]
      },
      // tooltip options
      tooltip: {
        disable: false,
      },
})
See Also:
 Rotating Circle Menu With JavaScript And CSS – Pentagon Menu
 Lightweight CSS Animation Framework – Efecss.css
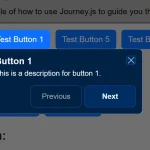 Build Interactive Website Walkthroughs With Journey.js
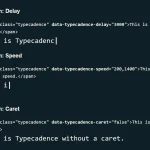 Natural Typing Animations In JavaScript – Typecadence
 Custom Tooltips and Popovers in JavaScript – show-tips
 Simplest Copy To Clipboard Library – simpleCopy
 Searchable Single & Multiple Select Plugin For Bootstrap 4
 Create Interactive Particle Backgrounds with Pure JavaScript – DotWave.js