


A circle chart or pie chart is a circular statistic graph, which represents the proportions of a whole.
Using a single div and some CSS you can build circle diagrams representing percentage values. You can also optionally have smooth transitions by using JavaScript.
See It In Action:
How to use it:
1. Add the CSS class circle-diagram to a DIV element and define a number expressed as a fraction of 100 using the --percent variable as follows:
<div class="circle-diagram" style="--percent: 12.5">12.5%</div>
<div class="circle-diagram" style="--percent: 50">59%</div>
<div class="circle-diagram" style="--percent: 75">75%</div>
<div class="circle-diagram" style="--percent: 100">100%</div>
...
2. Add the following CSS snippets to your page. That’s it.
.circle-diagram{
  --degree: calc(360deg / 100 * var(--percent));
  --hue: calc(360 / 100 * var(--percent));
  --accent-color: hsl(var(--hue), 100%, 50%);
  font-size: 1rem;
  width: 100%;
  max-width: 15rem;
  aspect-ratio: 1;
  position: relative;
  border-radius: 50%;
  filter: drop-shadow(0 0.5rem .5rem rgb(0 0 0 / .5));
  display: grid;
  place-items: center;
  font-weight: 700;
  font-family: system-ui, sans-serif;
  color: var(--accent-color);
  text-shadow: 0 0 5px rgb(0 0 0);
  cursor: pointer;
}
.circle-diagram::before, .circle-diagram::after{
  content: "";
  position: absolute;
  border-radius: 50%;
  z-index: -1;
}
.circle-diagram::before{
  inset: 1em;
  background-color: var(--accent-color);
  background-image:
    radial-gradient(
      circle at calc(50% - 0.25rem) calc(50% + 0.25rem),
      rgb(0 0 0 / .25) 25%,
      transparent calc(25% + 0.5rem)
    ),
    conic-gradient(
      rgb(255 255 255 / .25) 0deg,
      rgb(0 0 0 / .25) var(--degree)
    ),
    conic-gradient(
      at calc(50% - 0.4rem) calc(50% + 0.4rem),
      transparent var(--degree),
      rgb(0 0 0 / .25) calc(var(--degree) + 5deg)
    );
}
.circle-diagram::after{
  inset: 0;
  background-color: rgb(50 50 50);
  background-image: linear-gradient(transparent, rgb(0 0 0 / .5));
  --mask1: radial-gradient(black 25%, transparent calc(25% + 1px));
  --mask2: conic-gradient(transparent var(--degree), black calc(var(--degree) + .5deg));
  -webkit-mask-image: var(--mask1), var(--mask2);
  mask-image: var(--mask1), var(--mask2);
}
3. To enable smooth transitions, load the latest GSAP JavaScript animation library in the document.
<script src='https://unpkg.co/gsap@3/dist/gsap.min.js'></script>
4. And then add the following JavaScript snippets to your page.
// only for animation
const circleDiagrams = document.querySelectorAll('.circle-diagram')
circleDiagrams.forEach(circleDiagram => {
  circleDiagram.addEventListener("click", (e)=> animProp(e.target))
  animProp(circleDiagram)
})
function animProp(el){
  gsap.from(el, {"--percent": 0, duration: 3});
}
See Also:
 Lightweight Pie/Donut Charts with CSS Conic Gradients – Pietry
 Lightweight Responsive SVG Charts with CSS Transitions – Beaned-Charts
 High-Performance WebGPU Charting Library for Large Datasets – ChartGPU
 Basic Pie Chart In Pure JavaScript – ChartJS
 Minimal Bar/Line/Pie Chart JavaScript Library – Chartly.js
 Minimal SVG Donut/Pie Chart Generator – donut.js
 Minimal Pie & Ring (Donut) Chart JavaScript Library – Charty
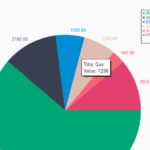 Easy Canvas Based Pie Chart Component – pie-chart-js