| Author: | MMelek00 |
|---|---|
| Views Total: | 10,887 views |
| Official Page: | Go to website |
| Last Update: | June 1, 2022 |
| License: | MIT |
Preview:

Description:
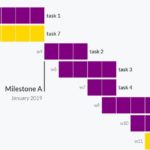
A simple, lightweight, interactive gantt chart where the users are able to add, edit, expand, collapse schedules on the client side.
How to use it:
To get started, insert the stylesheet frappe-gantt.css and JavaScript frappe-gantt.js into the html page.
<link rel="stylesheet" href="frappe-gantt.css">
<script src="frappe-gantt.js"></script>
Create an element to hold the gantt chart.
<div class="gantt-target"></div>
Create your own scheduled tasks in a JavaScript array as follows:
var tasks = [
    {
      start: '2018-10-01',
      end: '2018-10-08',
      name: 'Redesign website',
      id: "Task 0",
      progress: 91
    },
    {
      start: '2018-10-03',
      end: '2018-10-06',
      name: 'Write new content',
      id: "Task 1",
      progress: 55,
      dependencies: 'Task 0'
    },
    {
      start: '2018-10-04',
      end: '2018-10-08',
      name: 'Apply new styles',
      id: "Task 2",
      progress: 40,
      dependencies: 'Task 1'
    },
    {
      start: '2018-10-08',
      end: '2018-10-09',
      name: 'Review',
      id: "Task 3",
      progress: 20,
      dependencies: 'Task 2'
    },
    {
      start: '2018-10-08',
      end: '2018-10-10',
      name: 'Deploy',
      id: "Task 4",
      progress: 50,
      dependencies: 'Task 2'
    },
    {
      start: '2018-10-11',
      end: '2018-10-11',
      name: 'Go Live!',
      id: "Task 5",
      progress: 10,
      dependencies: 'Task 4',
      custom_class: 'bar-milestone'
    }
]
Generate a gantt chart inside the container element you created.
var gantt_chart = new Gantt(".gantt-target", tasks, {
    // options here
});
Available customization options.
var gantt_chart = new Gantt(".gantt-target", tasks, {
    header_height: 50,
    column_width: 30,
    step: 24,
    view_modes: [
      'Quarter Day',
      'Half Day',
      'Day',
      'Week',
      'Month',
      'Year'
    ],
    bar_height: 20,
    bar_corner_radius: 3,
    arrow_curve: 5,
    padding: 18,
    view_mode: 'Day',
    date_format: 'YYYY-MM-DD',
    popup_trigger: 'click',
    custom_popup_html: null,
    language: 'en'
});
Callback functions.
var gantt_chart = new Gantt(".gantt-target", tasks, {
    on_click: function (task) {
      console.log(task);
    },
    on_date_change: function(task, start, end) {
      console.log(task, start, end);
    },
    on_progress_change: function(task, progress) {
      console.log(task, progress);
    },
    on_view_change: function(mode) {
      console.log(mode);
    },
});
Changelog:
v0.6.1 (06/01/2022)
- Update


