


cyprobar is a lightweight JavaScript library that allows developers to draw circular percent graphs using SVG.
Easy to use and highly customizable. Ideal for creating circular progress bars to represent percentage data in a stylish way.
See Also:
How to use it:
1. Install and import the cyprobar library.
# NPM
$ npm i cyprobar --save
// Import as an ES module
import CPB from 'cyprobar'
// For browser:
<script src="./dist/cyprobar.js"></script>
2. Create a container in which the library draws the circular progress bar.
<div class="example"></div>
3. Draw a basic circular progress bar as follows:
CPB.draw({
  elementClass: 'example',
  value: "40" // 40%
});
4. The library also has the ability to automatically the percentage difference between two values you provide.
CPB.draw({
  elementClass: 'example',
  value: 2.7, // 27%
  maxValue: 10
});
5. The options below allow you to customize the appearance of the circular progress bar without writing any CSS code.
CPB.draw({
  // max: 1000
  barSize: 200,
  // background color
  barBgColor: 'grey',
  // 0-1
  barBgColorOpacity: '0',
  // custom text
  setText: 'CBP',
  // display text inside the graph
  useText: false,
  // value options
  value: 0,
  valueUnit: '%',
  valueColor: 'black',
  valueFont: 'monospace',
  valueFontSize: '60',
  valueOpacity: '1',
  maxValue: 100,
  // customize the indicator here
  indicatorSize: '15',
  indicatorColor: 'black',
  indicatorCap: 'acute-square',
  // customize the track here
  trackSize: 15,
  trackColor: '#eee',
  // set gradient here
  setGradient: [ ['rgba(0, 0, 0, 1)', 0], ['rgba(0, 0, 0, 0.5)', 50], ['rgba(0, 0, 0, 0.2)', 100] ]

});
See Also:
 Pure CSS Progress Bar Library with Custom Themes – progress-bar.css
 Modern TypeScript Progress Bar Library – BProgress
 3D Liquid Progress Bar in Pure CSS/CSS3
 Easy Scroll Position Tracking – ScrollProgress.js
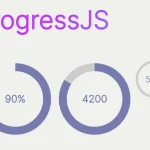 Visualize Progress Data With Animated, Circular Progress Bars – ProgressJS
 Radial Progress Indicator For Click-and-hold Actions – HoldCircleJS
 Simple Scroll Progress Indicator For Long Pages – PageBar.js
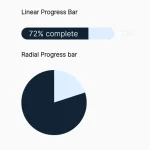 Generate Linear & Radial Progressbars Using CSS – Progress.css