


jsdragblocks is a JavaScript to visualize the relationship between two block elements by creating directional arrows between nodes via drag and drop.
Can be used to generate an editable flowchart to represent a workflow or process.
How to use it:
Insert the JavaScript file blocks.js into the HTML and we’re ready to go.
<script src="./blocks.js"></script>
Create a canvas element to place the block elements and directional arrows.
<canvas id="myCanvas"></canvas>
Add block elements with nodes to the canvas.
var block_viewer = new CanvasBlockViewer('myCanvas');
block_viewer.addBlock(new Block('name1', 100, 200, 140, 65, 1, 2));
block_viewer.addBlock(new Block('name2', 400, 300, 140, 65, 3, 2));
Draw directional arrows between nodes.
block_viewer.addConnection('name1', 0, 'name2', 1);Customize the nodes and arrows.
drawBlock(ctx, selected) {
  ctx.lineWidth = 2;
  ctx.fillStyle = "#FFFFFF";
  ctx.fillRect(this.x, this.y, this.w, this.h);
  ctx.fillStyle = "#000000";
  ctx.font = this.font;
  ctx.textAlign = "center";
  ctx.textBaseline = "middle";
  ctx.fillText(this.name, this.x + this.w/2, this.y + this.h/2)
  if(selected) {
    ctx.strokeStyle = "#FF0000";
  }
  else {
    ctx.strokeStyle = "#000000";
  }
  ctx.strokeRect(this.x, this.y, this.w, this.h);

}
drawConnectors(ctx, _selected, color) {
ctx.fillStyle = color == null ? "#0000FF" : color;
this._draw_vertical_points(ctx, this.in_qtd, this.x);
this._draw_vertical_points(ctx, this.out_qtd, this.x + this.w);
}Changelog:
09/19/2019
- Update
09/14/2019
- Added zoom
09/12/2019
- Allows to customize the color of blocks.
09/08/2019
- Fixing bug, removing log and updating version
09/01/2019
- Bugfix: Removing connections from block if block is removed
08/26/2019
- Added functions to find and to remove a block
08/21/2019
- Added function to generate a human-readable JSON string to represent the blocks
See Also:
 Build Draggable Node Connections with the Power-Link Library
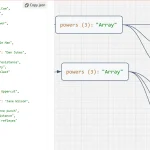 Generate SVG-based Flowcharts From JSON Data – jsontr.ee
 Drag And Drop Flowchart Builder – Drawflow
 Draw Object-based SVG Flow Charts With obfc.js
 SVG Based JS Code Flowchart Generator – js2flowchart
 Process Flow Diagram In Pure CSS
 Create Interactive Flowchart With JavaScript And Canvas – diagramflowjs
 Draw Flow Diagrams From Plain Text – Pinker.js