


Pinker.js is a vanilla JavaScript library which renders a canvas based flow chart from plain text to represents a workflow, process, or decisions.
Basic usage:
Download and import the Pinker.js library into the HTML document.
<script src='Pinker.js'></script>
Create a canvas element on which you want to draw the flow chart.
<canvas id="Canvas-Demo"></canvas>
Wrap the source (text/string) into a pre tag.
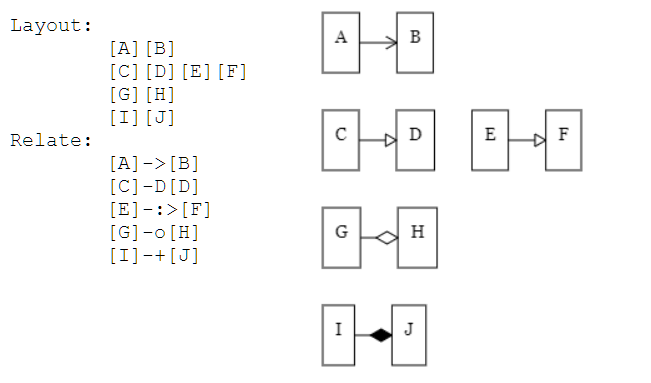
<pre id="Source-Example">
Layout:
  [A][B]
  [C][D][E][F]
  [G][H]
  [I][J]
Relate:
  [A]->[B]
  [C]-D[D]
  [E]-:>[F]
  [G]-o[H]
  [I]-+[J]
</pre>
Render a flow chart on the canvas element you just created.
var canvas = document.getElementById("Canvas-Example");
    source = document.getElementById("Canvas-Example").innerHTML;
pinker.draw(canvas, source);
The library also supports multi-level chart nodes.

<pre id="Source-Example">
Layout:
  [A][B]
[A]:
  Layout:
    [C][D]
  Relate:
    [C]->[D]
    [D]->[B.E]
[B]:
  Layout:
    [E]
    [F]
  Relate:
    [E]->[F]
    [F]->[A.D]
</pre>
You can also load the chart data from an external text file.
<object id="Source-Example" type="text/plain" data="Diagram-Example.txt" class="pinker"></object>
// Diagram-Example.txt
Layout:
  [A]
  [B][D][E]
  [C]...[F]
Relate:
  [B]->[A],[C]
  [D]->[B],[E],[F]
pinker.render();
Possible options to customize the flow chart.
pinker.config = {
  // font size in pixels
  fontSize: 14,
  // font family
  fontFamily: "Georgia",

  // minimum space around each scope
  scopeMargin: 30,

  // minimum space between scope boundary and scope contents
  scopePadding: 10,
  // minimum space between scope boundary and text areas
  labelPadding: 10,
  // minimum space between canvas boundary and scopes
  canvasPadding: 15,
  // background color
  backgroundColor: "#FFFFFF",
  // shade color
  shadeColor: "#EEEEEE",
  // line color
  lineColor: "#000000",
  // line weight
  lineWeight: 1,
  // length of a dash in pixels
  lineDashLength: 5,
  // length of space between dashes in pixels
  lineDashSpacing: 3,
  // pixels-squared area of an arrow head
  arrowHeadArea: 50,
  // should multi-line labels be arranged with a width:height ratio close to 1.6
  favorGoldenRatioLabelSize: true

  // should sibling-nodes be resized to appear similar?
  favorUniformNodeSizes: true

  // instead of drawing straight lines between scopes, draw arrows to route around scopes
  useSmartArrows: true

  // on render(), add the diagram next to the source instead of overwriting the source
  keepSource: false
  font: function() {
    return this.fontSize + "px " + this.fontFamily;
  },
  estimateFontHeight: function() {
    return this.fontSize;
  },
  lineSpacing: function() {
    return this.estimateFontHeight() * 0.4;
  }
};
Changelog:
09/11/2019
- Fixed Separator lines margin error
v1.3.0 (06/30/2019)
- support labels on relationship lines/arrows
- support passing multiple options into render() and draw()
- support arrows pointing right or left; support double-headed arrows
- support lists on both sides of a Relate line
- support dotted lines
- support quantitative arrows
- bug fix: parsing Relate row when label contains a comma
- refactoring
- test cases
v1.2.0 (06/20/2019)
- support passing in all configuration changes as options object on render() and draw()
v1.1.0 (06/11/2019)
- favor horizontal/vertical lines over angled lines
- favor golden-ratio labels
- favor more homogeneous scope sizes
- update plain arrow head for visibility
- update arrow head sizes to be more regular
- clean up define-section layout
- center sub-diagrams in each scope
- move more layout control into pinker.config
- refactoring
See Also:
 Build Draggable Node Connections with the Power-Link Library
 Generate SVG-based Flowcharts From JSON Data – jsontr.ee
 Drag And Drop Flowchart Builder – Drawflow
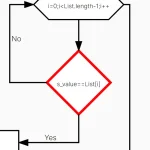 Draw Object-based SVG Flow Charts With obfc.js
 SVG Based JS Code Flowchart Generator – js2flowchart
 Process Flow Diagram In Pure CSS
 Create Interactive Flowchart With JavaScript And Canvas – diagramflowjs
 Draw Directional Arrows Between Nodes – jsdragblocks