


Gnet.js is a data visualization JavaScript library that draws animated customizable network diagrams on a canvas element to visually present networks of connected nodes and links.
How to use it:
1. Import the gnet.min.js into the document.
<script src="dist/gnet.min.js"></script>
2. Create a container to hold the network diagram.
<div id="myDiagram"></div>
3. Create a new instance of the network diagram.
const graph = new Gnet('#container',{
      // canvas size in pixels
      width : '500',
      height : '500',
});
4. Add data (nodes and links) to the network diagram.
const data = {
      nodes : [
        {id: "A", group: 1},
        {id: "B", group: 2},
        {id: "C", group: 1},
        {id: "D", group: 2},
        {id: "E", group: 3},
        {id: "F", group: 4},
        {id: "G", group: 5},
        {id: "H", group: 6}
      ],
      links :  [{
        source : "A",
        target : "B",
        value  : 1
      },{
        source : "C",
        target : "D",
        value  : 2
      },{
        source : "A",
        target : "D",
        value  : 3
      },{
        source : "E",
        target : "F",
        value  : 2
      },{
        source : "G",
        target : "H",
        value  : 1
      }]
};
graph.addData(data);
5. Render the network diagram on the canvas.
graph.run();
6. Customize the styles of the nodes.
const graph = new Gnet('#container',{
      // canvas size in pixels
      width : '500',
      height : '500',
      nodeStyle : {
        radius : 3,
        color  : '#ff0000',
        borderColor: "#fff",
      },
      linkStyle: {
        color: "#aaa",
      },
      complete: function(status){
        // do something
      }
});
Changelog:
05/10/2021
- added ‘complete’ callback function
05/02/2021
- new link and node styles added
05/02/2021
- canvas blur issue fixed
See Also:
 Beautify Native Select Elements With JavaScript – nativejs-select
 Responsive Image Carousel Plugin With No Dependencies – Bamboo.js
 Stacked Sticky Elements In Pure JavaScript – stickystack
 Validate, Parse, Decode VINs With Universal VIN Decoder
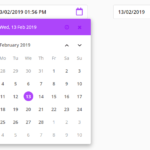 Beautiful Responsive Date & Time Picker Library – Window Date Picker
 Calculate The Number Of Digits After Decimal Point – countDecimals.js
 Minimal Slide-in Menu with JavaScript and CSS3 Transitions
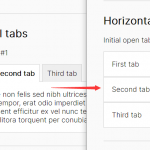 Responsive Tabs & Accordion Component In Vanilla JavaScript