


SVGChart is a dependency-free JavaScript line chart library that renders one or more numeric datasets as responsive SVG paths.
It works well for compact dashboards, reports, and other pages that need category-based line graphs with straight or smooth curves.
Each chart runs inside a closed Shadow DOM and redraws when its container size changes.
The library also exposes controls for line appearance, point markers, value labels, clipped area fills, and axis formatting.
Features:
- Single and multi-series SVG line charts.
- Straight and configurable smooth curves.
- Custom stroke colors, widths, and CSS effects.
- Point markers, value labels, and hover states.
- Clip-path areas with custom fill styles.
- Automatic redraws when chart dimensions change.
- Shadow DOM isolation with injected custom CSS.
How to use it:
1. Download and load the SVGChart.js library directly in your webpage.
<script src="SVGChart.js"></script>
2. Create a container, pass its element and X-axis labels to Chart(), then register the first dataset with chart.add(). Note that every list array must contain the same number of values as the labels array passed to Chart().
<div id="traffic-chart" style="height: 320px;"></div>
const trafficChart = Chart(
  document.getElementById('traffic-chart'),
  ['Mon', 'Tue', 'Wed', 'Thu', 'Fri']
);
trafficChart.add({
  list: [24, 38, 31, 46, 41],
  line: {
    color: '#2563eb',
    width: 3,
    curve: 0.6
  }
});
3. The optional third argument of Chart() controls chart-wide formatting and internal styles.
style(string): Injects custom CSS into the chart’s Shadow DOM.hide(string): Keeps the selected X-axis category label and tick visible. Pass an:nth-child()argument such as"(3)".range(function): Formats calculated values displayed on the Y axis.
const salesChart = Chart(
  document.getElementById('sales-chart'),
  ['Q1', 'Q2', 'Q3', 'Q4'],
  {
    style: `
      .chartp {
        --pointer: #7c3aed;
      }
    `,
    hide: '(3)',
    range(value) {
      return '$' + value;
    }
  }
);
4. The library also works with multiple datasets. Call chart.add() again for each additional series. Every series shares the original category labels.
const comparisonChart = Chart(
  document.getElementById('comparison-chart'),
  ['Jan', 'Feb', 'Mar', 'Apr', 'May']
);
comparisonChart.add({
  list: [18, 27, 24, 39, 44],
  line: {
    color: '#2563eb',
    curve: 0.5
  }
});
comparisonChart.add({
  list: [14, 22, 30, 34, 40],
  line: {
    color: '#ef4444',
    curve: 0.5
  }
});
5. chart.add() accepts the following dataset properties.
list(array): Numeric values for the series. Its length must match the chart’s labels array.line(object): Defines the rendered SVG line.clip(boolean or number): Creates a clipping path for an area associated with the line. The documented forms aretrueand-1.clip_style(string): Supplies CSS for the clipped area.value_show(function): Formats the value text associated with each data point.pointer(string): Supplies CSS for the dataset’s point stem.pointer_hover(string): Changes point-stem styling when its category is hovered.value(string): Supplies CSS for the dataset’s value label.value_hover(string): Changes value-label styling on hover.spot(string): Supplies CSS for the point marker.spot_hover(string): Changes point-marker styling on hover.
6. The line object accepts four properties.
color(string): Sets the SVG stroke color.width(number): Sets the line thickness.curve(number): Controls curve smoothing from0to1. A value of0produces straight segments.style(string): Applies inline CSS to the SVG path.
chart.add({
  list: [32, 41, 37, 52, 48],
  line: {
    color: '#0f766e',
    width: 4,
    curve: 0.6,
    style: `
      filter: drop-shadow(0 0 6px rgba(15, 118, 110, 0.35));
    `
  }
});
7. Format Point Values. value_show receives the numeric value and its matching category label. Return the text that should appear for that point.
chart.add({
  list: [120, 165, 148, 210],
  line: {
    color: '#16a34a',
    curve: 0.4
  },
  value_show(value, label) {
    return label + ': $' + value;
  }
});
8. The chart-wide range callback performs the same type of formatting for Y-axis values.
const revenueChart = Chart(
  document.getElementById('revenue-chart'),
  ['Q1', 'Q2', 'Q3', 'Q4'],
  {
    range(value) {
      return '$' + value + 'k';
    }
  }
);
9. Create an area fill. Set clip on the dataset and use clip_style for the area background. Gradients work well for a line chart that needs extra visual emphasis below the plotted path.
chart.add({
  list: [26, 43, 35, 58, 51],
  line: {
    color: '#0284c7',
    width: 3,
    curve: 0.6
  },
  clip: true,
  clip_style: `
    background:
      linear-gradient(
        to top,
        rgba(2, 132, 199, 0.3),
        transparent
      );
  `
});
10. Customize points and value labels:
chart.add({
  list: [12, 28, 21, 36],
  line: {
    color: '#9333ea',
    width: 3
  },
  spot: `
    background: #9333ea;
    padding: 6px;
  `,
  spot_hover: `
    padding: 8px;
  `,
  value: `
    background: #1f2937;
    color: #ffffff;
  `,
  value_hover: `
    background: #111827;
  `
});
11. SVGChart creates a closed Shadow DOM for each chart. Page-level selectors cannot directly target internal elements such as .chartp. Pass internal CSS through the chart’s style option when you need to override its built-in CSS variables.
--pointer: Point marker color.--line: Grid and tick color.--bakcground-value: Value-label background color. Keep the library’s existingbakcgroundspelling.--color-value: Value-label text color.
const themedChart = Chart(
  document.getElementById('themed-chart'),
  ['A', 'B', 'C', 'D'],
  {
    style: `
      .chartp {
        --pointer: #f97316;
        --line: rgba(15, 23, 42, 0.12);
        --bakcground-value: #0f172a;
        --color-value: #ffffff;
      }
    `
  }
);
12. API methods.
// Registers another dataset.
chart.add({
  list: [18, 26, 33, 29],
  line: {
    color: '#2563eb'
  }
});
// Removes the dataset at the specified zero-based index.
chart.remove(0);
// Clears the registered datasets.
chart.remove();
// Re-renders the current chart.
chart.refresh();
Alternatives:
- ApexCharts.js: Responsive, Interactive SVG Chart Library for Dashboards and Apps
- Lightweight Responsive SVG Charts with CSS Transitions – Beaned-Charts
- Tiny Customizable SVG Line Chart Library – oi.linechart.js
- Hand-drawn Style SVG Chart Library – chart.xkcd
See Also:
 High-Performance WebGPU Charting Library for Large Datasets – ChartGPU
 Responsive CSS Chart Library For Web – Neo Charts
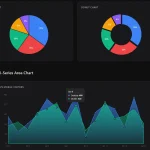 Lightweight Responsive SVG Charts with CSS Transitions – Beaned-Charts
 Line Chart With Grid Lines – Graphika.js
 Financial Data Visualization Library for JavaScript – VisionCharts
 Creating Hand-Drawn Style Line Charts with JavaScript – Handwritten Graph
 Minimal Bar/Line/Pie Chart JavaScript Library – Chartly.js
 Text-based Charting Library For Terminal & Browser Console – text-graph.js