


ViewHeatmap.js is a JavaScript library that generates a CANVAS based heat map on your webpage screenshot to visualize how far the visitors scroll down your page.
How to use it:
Include the ViewHeatmap.js script into the document.
<script src="viewheatmap.js"></script>
Create an Html5 canvas element for the heat map.
<canvas id="target"></canvas>
Create screen height and scroll position data for the heat map by using JavaScript array.
var positionData = [
  {
    // The screen height of the visitor's device
    height: 100,
    //The scroll positions recorded periodically
    positions: [ 0, 10, 15, 20, 25, 30, 35, 40 ]
  }
        ,
  {
    height: 100,
    positions: [ 25, 30, 35, 40, 45, 50, 55, 60 ]
  }
        ,
  {
    height: 100,
    positions: [ 225, 230, 235, 240, 245, 250, 255, 260 ]
  }
];
Initialize the heat map with options.
new Heatmap(
  // target canvas element
  'target',
  // webpage screenshot
  'demo.png',
  // scroll depth data
  positionData,
    {
      // Alpha of screenshot. [0, 1]
      screenshotAlpha: 0.6,
      // Alpha of heatmap. [0, 1]
      heatmapAlpha: 0.8,
      //if 'simple' specified, render heatmap with simple transparent to red gradient.
      colorScheme: 'simple'
    }
);
See Also:
 Generate Customizable Heat Maps For Date-based Activities – Heat.js
 Responsive CSS Chart Library For Web – Neo Charts
 Simple Heat Map Generator with JavaScript and Canvas – Simpleheat
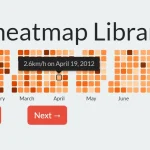 Customizable And Extensible Calendar Heatmap Library – cal-heatmap
 Easy Calendar Heatmap Web Component – contributions-calendar.js
 Github Style Contribution Graph In JavaScript – Heatmap.js
 Minimalist Sliding Toast Notification Library – Toast.js
 Responsive Table with Pure CSS