


Heat.js is a lightweight JavaScript library that generates customizable heat maps to visualize date-based activity and trends.
It uses color shading in calendar blocks to indicate intensity: lighter colors for less activity, darker colors for more.
Inspired by GitHub’s contribution graph, Heat.js is great for showcasing user activity, website traffic, or any other time-based data.
Features:
- Six Visualization Modes: Switch between Map, Line, Chart, Days, Months, and Color Ranges views to analyze data from different perspectives.
- Multi-Language: 60 built-in language translations for international applications.
- Theme System: 31 ready-made CSS themes with full support for custom theming through CSS variables.
- Export Flexibility: Export data in nine formats including “csv”, “xml”, “txt”, “md”, “html”, “tsv”, “yaml”, and “toml”.
- Import Capability: Import existing data from seven different file formats.
- Trend Segregation: Split data into distinct trend types for separate analysis and visualization.
- Responsive Design: Fully responsive layout styled with CSS/SASS and compatible with Bootstrap.
- Custom Year Ranges: Configure fiscal year displays or any custom month range beyond the standard January to December.
Use Cases:
- Developer Activity Tracking: Display commit patterns, pull request frequency, or code review activity across time periods to identify productivity trends and workflow patterns.
- User Engagement Analytics: Visualize daily active users, login frequency, or feature usage to spot engagement drops and plan retention strategies.
- Content Publishing Calendars: Track article publishing frequency, social media posting patterns, or content campaign timing to maintain consistent output schedules.
- System Monitoring Dashboards: Monitor server uptime, error rates, API call volumes, or deployment frequency to quickly identify anomalies and operational issues.
How to use it:
1. Download the package and load the following JS/CSS files in the document.
<!-- Core -->
<link rel="stylesheet" href="/dist/heat.js.min.css" />
<script src="/dist/heat.min.js"></script>
<!-- Themes -->
<link rel="stylesheet" href="/dist/theme/heat.js.light.theme.css" />
<!-- Languages -->
<script src="/dist/translations/heat.translations.en.js"></script>
<script src="/dist/translations/heat.translations.es.js"></script>
<script src="/dist/translations/heat.translations.fr.js"></script>
...
2. Create a container to hold the heat map and pass the options via data-heat-js attribute. All possible options and callbacks:
- views.map: This sets specific configuration overrides for the map view.
- views.line: This sets specific configuration overrides for the line view.
- views.chart: This sets specific configuration overrides for the chart view.
- views.days: This sets specific configuration overrides for the days view.
- views.months: This sets specific configuration overrides for the months view.
- views.colorRanges: This sets specific configuration overrides for the color ranges view.
- views.colorRanges.totalYAxisLabels: 7
- views.colorRanges.showHorizontalChartLines: false
- views.map.showDayNames: true
- views.map.showMonthDayGaps: true
- views.map.showMonthNames: true
- views.map.monthsToShow: [ 1, 2, 3, 4, 5, 6, 7, 8, 9, 10, 11, 12 ]
- views.map.daysToShow: [ 1, 2, 3, 4, 5, 6, 7 ]
- views.map.placeMonthNamesOnTheBottom: false
- views.map.showDaysInReverseOrder: false
- views.map.showDayNumbers: false
- views.map.keepScrollPositions: false
- views.map.showShortYearsInMonthNames: false
- views.chart.enabled: true
- views.chart.showMonthNames: true
- views.chart.monthsToShow: [ 1, 2, 3, 4, 5, 6, 7, 8, 9, 10, 11, 12 ]
- views.chart.daysToShow: [ 1, 2, 3, 4, 5, 6, 7 ]
- views.chart.showChartYLabels: true
- views.chart.showInReverseOrder: false
- views.chart.showLineCounts: false
- views.chart.keepScrollPositions: false
- views.chart.showToolTips: true
- views.chart.useGradients: false
- views.chart.usePoints:false
- views.chart.showHorizontalChartLines: false
- views.chart.showShortYearsInMonthNames: false
- views.statistics.enabled: true
- views.statistics.monthsToShow: [ 1, 2, 3, 4, 5, 6, 7, 8, 9, 10, 11, 12 ]
- views.statistics.showInReverseOrder: false
- views.statistics.daysToShow: [ 1, 2, 3, 4, 5, 6, 7 ]
- views.statistics.showChartYLabels: true
- views.statistics.showColorRangeLabels: true
- views.statistics.useColorRangeNamesForLabels: false
- views.statistics.showRangeNumbers: false
- views.statistics.keepScrollPositions: false
- views.statistics.showToolTips: true
- views.statistics.useGradients: false
- views.map.showMinimalDayNames: false
- views.map.showMonthsInReverseOrder: false
- views.map.showDayDateNumbers: false
- views.map.showToolTips: true
- views.map.showStartEndYearDays: true
- views.chart.showDayCounts: false
- views.chart.totalYAxisLabels: 7
- views.days.enabled: true
- views.days.showChartYLabels: true
- views.days.showDayNames: true
- views.days.showInReverseOrder: false
- views.days.showDayCounts: false
- views.days.monthsToShow: [1, 2, 3, 4, 5, 6, 7, 8, 9, 10, 11, 12]
- views.days.daysToShow: [1, 2, 3, 4, 5, 6, 7]
- views.days.keepScrollPositions: false
- views.days.showToolTips: true
- views.days.useGradients: false
- views.days.useDifferentOpacities: true
- views.days.showHorizontalChartLines: false
- views.days.totalYAxisLabels: 7
- views.months.showHorizontalChartLines: false
- views.months.totalYAxisLabels: 7
- views.line.showShortYearsInMonthNames: false
- title.text: “Heat.js”
- title.showText: true
- title.showYearSelector: true
- title.showRefreshButton: false
- title.showExportButton: false
- title.extraSelectionYears: 50
- title.showYearSelectionDropDown: true
- title.showImportButton: false
- title.showConfigurationButton: true
- title.showTitleDropDownButton: true
- title.showTitleDropDownHeaders: true
- title.showCurrentYearButton: true
- title.showSectionText: true
- title.showToolTips: true
- description.text: null
- description.url: null
- description.urlTarget: ‘_blank’
- guide.enabled: true
- guide.colorRangeTogglesEnabled: true
- guide.showLessAndMoreLabels: true
- guide.showNumbersInGuide: false
- guide.showToolTips: true
- tooltip.delay: 750
- tooltip.dayText: “{d}{o} {mmmm} {yyyy}”
- zooming.incrementDivision: 10
- zooming.cssDecimalPoints: 2
- exportOnlyDataBeingViewed: This determines if the library exports only the currently visible data. It defaults to true.
- defaultYear: This sets the initial year displayed upon the first render. It defaults to the current year.
- defaultView: This defines the default view mode. Accepted values include map, line, chart, days, months, and color-ranges.
- exportType: This specifies the default file format for data exports. It defaults to json.
- useLocalStorageForData: This enables data persistence via local storage. It maintains data across browser sessions.
- yearsToHide: This defines an array of years that the UI should not display. It defaults to an empty array.
- dataFetchDelay: This sets the interval in milliseconds between automated data fetch requests. The default is 60000.
- showOnlyDataForYearsAvailable: This limits the year selector to only those years containing data. It prevents the selection of empty years.
- showHolidaysInDayToolTips: This includes holiday names within the standard day tooltips. It defaults to false.
- resizable: This enables horizontal resizing for the heatmap container. It defaults to false.
- startMonth: This specifies the starting month of the year. 0 represents January. This supports custom fiscal years.
- allowMultipleFileImports: This enables the user to import multiple files at once. It defaults to true.
- percentageDecimalPoints: This sets the precision level for percentage values. The default is 2 decimal places.
- chartsAnimationDelay: This defines the delay in milliseconds before chart growth animations trigger. Set this to 0 to disable animations.
- exportDateTimeFormat: This sets the date and time string format used in exported files.
- sideMenu: This configures the options and visibility for the side navigation menu.
- title: This defines the configuration for the title bar component.
- yearlyStatistics: This sets the display options for the yearly statistics section.
- description: This configures the content and appearance of the description area.
- guide: This defines the settings for the color guide or legend area.
- zooming: This configures the zoom level settings and controls.
- tooltip: This sets the global configuration for all floating tooltips.
- holidays: This defines an array of holiday objects to highlight in the views.
- dynamicColorRange: This configures the settings for automatically generated color ranges.
- colorRanges: This defines specific color thresholds and CSS classes for data intensity.
- dynamicColorRange.hoverOpacity: 0.7
- dynamicColorRange.startName: ‘Day Color’
- dynamicColorRange.overrideCheckBoxColors: true
<div data-heat-js="{ 'showDayNames': true, 'views': { 'map': { 'showDayNames': true } }, onDayClick': onDayClick }">
  ...
</div>
3. All callback functions (events).
- onChange: function(element){} – Triggers when the layout or view configuration changes.
- onBeforeRender: function(element){} – Triggers immediately before the element rendering process starts.
- onRenderComplete: function(element){} – Triggers after the element completes its rendering cycle.
- onRefresh: function(element){} – Triggers when an existing heatmap instance refreshes its UI.
- onDestroy: function(element){} – Triggers when the library reverts an element to its original DOM state.
- onMapDayToolTipRender: function(element, date, count, year, isHoliday){} – Triggers during the rendering of a tooltip in the map view.
- onLineDayToolTipRender: function(element, date, count, year, isHoliday){} – Triggers during the rendering of a tooltip in the line view.
- onChartDayToolTipRender: function(element, date, count, year, isHoliday){} – Triggers during the rendering of a tooltip in the chart view.
- onBackYear: function(element, year){} – Triggers when the user navigates to the previous year.
- onNextYear: function(element, year){} – Triggers when the user navigates to the next year.
- onSetYear: function(element, year){} – Triggers when the year is updated via manual selection or API.
- onMapDayClick: function(element, date, count, year, isHoliday){} – Triggers when a user clicks a day block in the map view.
- onMapDayDblClick: function(element, date, count, year, isHoliday){} – Triggers when a user double-clicks a day block in the map view.
- onLineDayClick: function(element, date, count, year, isHoliday){} – Triggers when a user clicks a data point in the line view.
- onLineDayDblClick: function(element, date, count, year, isHoliday){} – Triggers when a user double-clicks a data point in the line view.
- onChartDayClick: function(element, date, count, year, isHoliday){} – Triggers when a user clicks a bar in the chart view.
- onChartDayDblClick: function(element, date, count, year, isHoliday){} – Triggers when a user double-clicks a bar in the chart view.
- onWeekDayClick: function(element, dayNumber, count, year){} – Triggers when a user clicks a specific weekday in the days view.
- onWeekDayDblClick: function(element, dayNumber, count, year){} – Triggers when a user double-clicks a specific weekday in the days view.
- onMonthClick: function(element, monthNumber, count, year){} – Triggers when a user clicks a month block in the months view.
- onMonthDblClick: function(element, monthNumber, count, year){} – Triggers when a user double-clicks a month block in the months view.
- onColorRangeClick: function(element, colorRange, count, year){} – Triggers when a user clicks an item in the color ranges view.
- onColorRangeDblClick: function(element, colorRange, count, year){} – Triggers when a user double-clicks an item in the color ranges view.
- onAddType: function(element, type){} – Triggers after the library adds a new trend type.
- onRemoveType: function(element, type){} – Triggers after the library removes an existing trend type.
- onAddDate: function(element){} – Triggers when the library adds new date data to an element.
- onRemoveDate: function(element){} – Triggers when the library removes date data from an element.
- onReset: function(element){} – Triggers after the library clears all data from an element.
- onExport: function(element){} – Triggers when the data export process initiates.
- onImport: function(element){} – Triggers when the data import process completes.
- onDataFetch: function(element){} – Triggers when the element requests a data pull. It requires a data object return.
- onClearDate: function(element){} – Triggers when a specific date is cleared from the dataset.
- onUpdateDate: function(element){} – Triggers when an existing date entry is updated.
- onClearViewableData: function(element){} – Triggers when the library clears only the data currently visible in the UI.
- onTypeSwitch: function(element, type){} – Triggers when the user switches the active trend type.
- onViewSwitch: function(element, view){} – Triggers when the user switches the active view mode.
- onColorRangeTypeToggle: function(element, id, visible){} – Triggers when a user toggles the visibility of a specific color range.
- onZoomLevelChange: function(element, zoomLevel){} – Triggers when the zoom level of the heatmap changes.
- onBindingOptionsUpdate: function(element, bindingOptions){} – Triggers after the original binding options for an element are updated.
4. Available configurations.
$heat.setConfiguration({
  safeMode: false,
  domElementTypes: "*",
  observationMode: true,
  text: {
    stText: "st",
    ndText: "nd",
    rdText: "rd",
    thText: "th",
    backButtonText: "Back",
    nextButtonText: "Next",
    refreshButtonText: "Refresh",
    exportButtonText: "Export",
    lessText: "Less",
    moreText: "More",
    dateText: "Date",
    countText: "Count",
    monthNames: '[ "Jan", "Feb", "Mar", "Apr", "May", "Jun", "Jul", "Aug", "Sep", "Oct", "Nov", "Dec" ],
    dayNames: '[ "Mon", "Tue", "Wed", "Thu", "Fri", "Sat", "Sun" ]'),
    dateText: 'Date',
    countText: 'Count',
    mapText: 'Map',
    chartText: 'Chart',
    noChartDataMessage: 'There is currently no data to view.',
    statisticsText: 'Statistics',
    noStatisticsDataMessage: 'There is currently no statistics to view.',
    unknownTrendText: 'Unknown',
    importButtonText: 'Import',
    noMapDataMessage: 'There is currently no data to view.',
    objectErrorText: 'Errors in object: {{error_1}}, {{error_2}}',
    attributeNotValidErrorText: 'The attribute '{{attribute_name}}' is not a valid object.',
    attributeNotSetErrorText: 'The attribute '{{attribute_name}}' has not been set correctly.',
    closeToolTipText: "Close",
    configurationToolTipText: "Configuration",
    configurationTitleText": "Configuration",
    visibleMonthsText": "Visible Months",
    visibleDaysText: "Visible Days",
    dataText: "Data",
    colorRangesText: "Color Ranges",
    yearText: "Year",
    daysText: "Days",
    noDaysDataMessage: "There are currently no days to view.",
    backButtonSymbolText: "←",
    nextButtonSymbolText: "→",
    refreshButtonSymbolText: "↻",
    exportButtonSymbolText: "↓",
    importButtonSymbolText: "↑",
    currentYearSymbolText: "⏎",
    currentYearText: "Current Year",
  }
})
5. More API methods.
// Adds a new empty trend type to a specific element
$heat.addType('elementId', 'TrendName', true);
// Removes an existing trend type from an element
$heat.removeType('elementId', 'TrendName', true);
// Adds an array of dates for a specific element ID
$heat.addDates('elementId', [new Date()], 'TrendName', true);
// Adds a single date and increases its value if it exists
$heat.addDate('elementId', new Date(), 'TrendName', true);
// Updates a date with a specific count
$heat.updateDate('elementId', new Date(), 5, 'TrendName', true);
// Removes an array of dates (decreases value by one)
$heat.removeDates('elementId', [new Date()], 'TrendName', true);
// Removes a single date (decreases value by one)
$heat.removeDate('elementId', new Date(), 'TrendName', true);
// Clears a date completely for a specific element
$heat.clearDate('elementId', new Date(), 'TrendName', true);
// Removes all dates for all rendered elements
$heat.resetAll(true);
// Removes all dates for a specific element ID
$heat.reset('elementId', true);
// Imports data from file objects or opens the import dialog
$heat.import('elementId', files);
// Exports all data for a specific element ID in the chosen format
$heat.export('elementId', 'json');
// Refreshes a specific Heat.js instance
$heat.refresh('elementId');
// Refreshes all rendered Heat.js instances
$heat.refreshAll();
// Sets the year to be displayed for an element
$heat.setYear('elementId', 2026);
// Sets the year to the highest year available in the data
$heat.setYearToHighest('elementId');
// Sets the year to the lowest year available in the data
$heat.setYearToLowest('elementId');
// Moves the displayed year back by one
$heat.moveToPreviousYear('elementId');
// Moves the displayed year forward by one
$heat.moveToNextYear('elementId');
// Moves the view to the current calendar year
$heat.moveToCurrentYear('elementId');
// Gets the year currently being displayed
$heat.getYear('elementId');
// Renders a new map on an element with specific options
$heat.render(domElement, options);
// Finds all new map elements and renders them automatically
$heat.renderAll();
// Switches the active view (e.g., "map", "chart", "days")
$heat.switchView('elementId', 'chart');
// Switches the selected trend type on an element
$heat.switchType('elementId', 'TrendName');
// Updates the original binding options and refreshes the element
$heat.updateBindingOptions('elementId', newOptions);
// Gets the name of the active view being displayed
$heat.getActiveView('elementId');
// Reverts an element to its original state
$heat.destroy('elementId');
// Reverts all rendered elements to their original state
$heat.destroyAll();
// Sets global configuration options
$heat.setConfiguration(configOptions, true);
// Sets global configuration text and locale options
$heat.setLocale(localeOptions, true);
// Returns an array of all rendered element IDs
$heat.getIds();
// Returns the current version of Heat.js
$heat.getVersion();
5. Override the default CSS variables to create your own styles.
:root {
  --heat-js-default-font: system-ui,
      -apple-system,
      "Segoe UI",
      Roboto,
      "Helvetica Neue",
      "Noto Sans",
      "Liberation Sans",
      Arial,
      sans-serif,
      "Apple Color Emoji",
      "Segoe UI Emoji",
      "Segoe UI Symbol",
      "Noto Color Emoji";
  // Font Weights
  --heat-js-text-font-weight-thin: 400;
  --heat-js-text-font-weight-heavy: 900;
  --heat-js-text-font-weight-medium: 700;
  // Colors
  --heat-js-color-black: #3b3a3a;
  --heat-js-color-white: #adbac7;
  --heat-js-color-snow-white: #F5F5F5;
  --heat-js-color-gray: #AAAAAA;
  --heat-js-color-light-gray: #BBBBBB;
  --heat-js-color-highlight: 245, 245, 245;
  --heat-js-color-black-dark: #11161e;
  --heat-js-color-default-dynamic: #4169e1;
  // Containers
  --heat-js-container-background-color: #22272e;
  --heat-js-container-border-color: #454c56;
  // Side-Menu
  --heat-js-side-menu-text-color: var(--heat-js-color-snow-white);
  --heat-js-side-menu-active-text-color: var(--heat-js-color-snow-white);
  // Dialogs
  --heat-js-dialog-background-color: var(--heat-js-container-background-color);
  --heat-js-dialog-border-color: var(--heat-js-container-border-color);
  --heat-js-dialog-text-color: var(--heat-js-color-white);
  // Title Bar / Drop Down Menu
  --heat-js-title-opener-text-color-hover: var(--heat-js-color-gray);
  --heat-js-title-background-color: var(--heat-js-color-black-dark);
  --heat-js-title-border-color: var(--heat-js-container-border-color);
  --heat-js-title-text-color: var(--heat-js-color-white);
  --heat-js-title-background-color-hover: var(--heat-js-button-background-color-hover);
  --heat-js-title-text-color-hover: var(--heat-js-color-snow-white);
  --heat-js-title-menu-item-height: 36px;
  // Title Bar - Year Drop Down Menu
  --heat-js-years-background-color: var(--heat-js-color-black-dark);
  --heat-js-years-border-color: var(--heat-js-container-border-color);
  --heat-js-years-text-color: var(--heat-js-color-white);
  --heat-js-years-background-color-hover: var(--heat-js-button-background-color-hover);
  --heat-js-years-text-color-hover: var(--heat-js-color-snow-white);
  --heat-js-years-current-color: var(--heat-js-day-color-4-background-color);
  --heat-js-years-menu-item-height: 36px;
  --heat-js-years-menu-total-rows-in-view: 7;
  // ToolTips
  --heat-js-tooltip-background-color: var(--heat-js-color-black-dark);
  --heat-js-tooltip-border-color: var(--heat-js-container-border-color);
  --heat-js-tooltip-text-color: var(--heat-js-color-white);
  --heat-js-tooltip-count-background-color: var(--heat-js-day-background-color);
  // Holidays
  --heat-js-holiday-background-color: rgba( 210, 43, 43, 0.75 );
  --heat-js-holiday-border-color: rgba( 210, 43, 43, 0.5 );
  --heat-js-holiday-text-color: var(--heat-js-color-white);
  // Views
  --heat-js-view-opacity-hover: 0.7;
  --heat-js-view-opacity-active: 0.5;
  // View - Map / Chart / Line - Day - Defaults
  --heat-js-day-background-color: #2d333b;
  --heat-js-day-border-color: var(--heat-js-container-border-color);
  --heat-js-day-background-color-hover: var(--heat-js-container-border-color);
  --heat-js-day-spacing: 5px;
  --heat-js-day-size: 20px;
  --heat-js-day-chart-width: 12px;
  --heat-js-day-chart-spacing: 3px;
  --heat-js-day-line-width: 3px;
  // View - Map / Chart - Day - Colors
  --heat-js-day-color-1-background-color: rgba( 80, 200, 120, 0.25 );
  --heat-js-day-color-1-border-color: rgba( 80, 200, 120, 0.15 );
  --heat-js-day-color-1-text-color: var(--heat-js-color-white);
  --heat-js-day-color-2-background-color: rgba( 80, 200, 120, 0.50 );
  --heat-js-day-color-2-border-color: rgba( 80, 200, 120, 0.25 );
  --heat-js-day-color-2-text-color: var(--heat-js-color-white);
  --heat-js-day-color-3-background-color: rgba( 80, 200, 120, 0.75 );
  --heat-js-day-color-3-border-color: rgba( 80, 200, 120, 0.50 );
  --heat-js-day-color-3-text-color: var(--heat-js-color-black);
  --heat-js-day-color-4-background-color: rgba( 80, 200, 120, 1 );
  --heat-js-day-color-4-border-color: rgba( 80, 200, 120, 0.75 );
  --heat-js-day-color-4-text-color: var(--heat-js-color-black);
  // View - Days - Colors
  --heat-js-view-days-background-color: var(--heat-js-day-color-4-background-color);
  --heat-js-view-days-border-color: var(--heat-js-day-color-4-border-color);
  --heat-js-view-days-text-color: var(--heat-js-day-color-4-text-color);
  // View - Months - Colors
  --heat-js-view-months-background-color: var(--heat-js-day-color-4-background-color);
  --heat-js-view-months-border-color: var(--heat-js-day-color-4-border-color);
  --heat-js-view-months-text-color: var(--heat-js-day-color-4-text-color);
  // Guide
  --heat-js-guide-day-size: var(--heat-js-day-size);
  --heat-js-guide-day-spacing: 6.3px;
  // Buttons
  --heat-js-button-background-color: var(--heat-js-day-background-color);
  --heat-js-button-border-color: var(--heat-js-container-border-color);
  --heat-js-button-text-color: var(--heat-js-color-white);
  --heat-js-button-background-color-hover: var(--heat-js-container-border-color);
  --heat-js-button-text-color-hover: var(--heat-js-color-snow-white);
  --heat-js-button-background-color-active: #616b79;
  --heat-js-button-color-disabled: #616060;
  --heat-js-button-text-color-active: var(--heat-js-color-snow-white);
  --heat-js-button-icon-size: 12px;
  --heat-js-button-icon-width: 32px;
  --heat-js-button-height: 30px;
  // Inputs/Selects
  --heat-js-input-background-color: var(--heat-js-day-background-color);
  --heat-js-input-border-color: var(--heat-js-container-border-color);
  --heat-js-input-text-color: var(--heat-js-color-white);
  // Yearly Statistics Box
  --heat-js-yearly-statistics-box-background-color: var(--heat-js-day-background-color);
  --heat-js-yearly-statistics-box-border-color: var(--heat-js-container-border-color);
  --heat-js-yearly-statistics-box-text-color: var(--heat-js-color-white);
  // CheckBoxes
  --heat-js-checkbox-background-color-checked: var(--heat-js-day-color-4-background-color);
  --heat-js-checkbox-background-color: var(--heat-js-color-black);
  --heat-js-checkbox-border-color-checked: var(--heat-js-checkbox-background-color-checked);
  --heat-js-checkbox-border-color: var(--heat-js-color-white);
  --heat-js-checkbox-border-radius: 2em;
  // Panels
  --heat-js-panel-background-color: var(--heat-js-day-background-color);
  --heat-js-panel-border-color: var(--heat-js-container-border-color);
  // Borders
  --heat-js-border-control-radius: 0.25rem;
  --heat-js-border-radius: 0.5rem;
  --heat-js-border-radius-day: 0.35rem;
  --heat-js-border-size: 0.5px;
  --heat-js-border-size-day: 1px;
  // Sizes
  --heat-js-spacing: 10px;
  --heat-js-spacing-half: calc( var(--heat-js-spacing) / 2 );
  --heat-js-spacing-double: calc( var(--heat-js-spacing) * 2 );
  --heat-js-spacing-font-size: 0.85rem;
  --heat-js-spacing-day-font-size: 0.6rem;
  --heat-js-left-border: 8px;
  --heat-js-default-width: 700px;
  --heat-js-default-width-with-side-menu: calc( var(--heat-js-default-width) + 50px );
  --heat-js-y-label-spacing: var(--heat-js-spacing-double);
  --heat-js-count-gap: 3px;
  // Transitions
  --heat-js-transition: all 0.3s;
  --heat-js-animation-length: 0.5s;
  // Scroll Bars
  --heat-js-scroll-bar-size: 4px;
  --heat-js-scroll-bar-thumb-color: #3b434e;
  --heat-js-scroll-bar-border-radius: 0.5rem;
}
Changelog:
v5.2.0 (05/31/2026)
- Added zooming support to the “Chart” view (when enabled).
- Added more options.
- Bugfixes and improvements.
v5.1.0 (03/27/2026)
- Added more options
- Bugfixes and improvements.
v5.0.1 (02/28/2026)
- Added new CSS variables for the Yes/No buttons shown on the confirmation dialog, which now default to a Green/Red scheme.
- The differences shown in the ToolTips now use a Green/Red scheme (with new CSS variables).
- Exported HTML files now use the export format date/time for the title, and some additional formatting updates and mobile view support.
- Exported MD files now contain a header that states the formatted last modified date/time.
v5.0.0 (02/02/2026)
- Added new themes, options and API methods.
- Allows you to to export all data to YAML (.yaml) and TOML (.toml).
- Allows you to import data from Markdown, YAML, and TOML.
v4.5.3 (12/02/2025)
- UI improvements, and a new checkbox style
v4.5.2 (11/30/2025)
- UI improvements and fixes
- Add new options
v4.5.1 (11/29/2025)
- Update and improvement
v4.5.0 (11/27/2025)
- Added support for custom year-month ranges! So instead of defaulting to Jan-Dec, you can now use something like Apr-Mar. The UI will now show the years when this is used.
- Added support to export all data to HTML (.html).
- Added support to export all data to Markdown (.md).
- Added support to export all data to Tab Separated Values (.tsv).
- Added support to import data from a Tab Separated Values file (.tsv).
- When the binding option “exportOnlyDataBeingViewed” is set to true, only data that is visible (months and days) will be exported.
- BREAKING: The binding option “exportOnlyYearBeingViewed” has been renamed to “exportOnlyDataBeingViewed”.
- Updated the binding option called “exportType” to have a new default value of “json”.
- Added a new binding option called “startMonth”, which states the first month in the year that should be displayed (allows an Apr-Mar view, and defaults to 0, for Jan).
- Added a new binding option called “views.map.showToolTips”, which states if the tooltips should be shown (defaults to true).
- Added a new binding option called “views.chart.showToolTips”, which states if the tooltips should be shown (defaults to true).
- Added a new binding option called “views.days.showToolTips”, which states if the tooltips should be shown (defaults to true).
- Added a new binding option called “views.statistics.showToolTips”, which states if the tooltips should be shown (defaults to true).
- Added a new binding option called “views.title.showToolTips”, which states if the tooltips should be shown (defaults to true).
- Added a new binding option called “views.guide.showToolTips”, which states if the tooltips should be shown (defaults to true).
- Added a new binding option called “views.chart.useGradients”, which states if the bar lines should use a gradient fill (defaults to false).
- Added a new binding option called “views.days.useGradients”, which states if the bar lines should use a gradient fill (defaults to false).
- Added a new binding option called “views.statistics.useGradients”, which states if the bar lines should use a gradient fill (defaults to false).
- Added a new binding custom trigger called “events.onDayDblClick”, which triggers when a day is double-clicked.
- Added a new binding custom trigger called “events.onWeekDayDblClick”, which triggers when a weekday is double-clicked.
- Added a new binding custom trigger called “events.onStatisticDblClick”, which triggers when a statistic is double-clicked.
- The title bar buttons now use a fixed height and width.
- The title bar buttons now align all content so it’s always central.
- When the counts/day dates are shown in the display, they are aligned vertically in the center.
- The side Y labels shown in the “Chart”, “Day”, and “Color Range” views are now always visible, even on mobile devices.
- Increased the right margin used for the bars in the “Chart” view by 0.5px.
- Fixed bugs.
v4.4.0 (11/24/2025)
- Added a new binding option called “resizable”, which states if horizontal resizing is enabled (defaults to false).
- Added a new configuration option called “observationMode”, which states if looking for new DOM elements with the Heat.js binding should be done automatically (defaults to true).
- Each day shown in the Map view now has a new attribute called “data-heat-js-map-date”, which stores the date for that map day.
- Each bar shown in the Chart view now has a new attribute called “data-heat-js-chart-date”, which stores the date for that chart day.
- Each bar shown in the Days view now has a new attribute called “data-heat-js-day-number”, which stores the day number.
- Each bar shown in the Color Ranges view now has a new attribute called “data-heat-js-statistics-color-range-name”, which stores the name of the Color Range (if stated).
- Added a new CSS variable “–heat-js-default-width”, which states what the default width should be.
- The label links (in the footer) now use a bottom border for the underline effect when hovered (which allows a smooth transition).
v4.3.2 (11/16/2025)
- Updated all the NPM packages to the latest versions.
- Added a new “year” parameter for the event “onStatisticClick”, which is now passed after the “rangeCount” parameter.
- Fixed the out-of-date BindingOptionsEvents for event triggers used when clicking in areas.
- The left border on the main display is now only shown on larger screens (giving a little more room on smaller/mobile screens).
- Added a new CSS variable called “–heat-js-scroll-bar-border-radius” (defaults to 0.5rem), which states the border radius the scrollbars should use.
- The CSS variable “–heat-js-day-size” now defaults to 1.2rem instead of 1.1rem, making the day boxes slightly larger.
- Added a new binding option called “views.map.showDayDateNumbers”, which states if the date day numbers should be shown (defaults to false).
- Added a new binding option called “views.chart.showLineDateNumbers”, which states if the date day numbers should be shown (defaults to false).
v4.3.2 (11/16/2025)
- Updated all the NPM packages to the latest versions.
- SCSS/CSS improvements (less code).
- The tooltips in the default dark view are now easier to see against the background.
- Added a new option called “title.showSectionText” (defaults to true), which states if the current section being shown should be displayed in the title text.
- Added some more spacing around the configuration dialog check boxes.
- Increased the size of the scrollbar to make it a bit easier to click.
- Added a new “isHoliday” parameter for the event “onDayClick”, which is now passed after the “count” parameter.
- Fixed missing data from the other test events.
- Updated the JS language usage in the documentation and testing HTML files.
- Added a new “year” parameter for the event “onWeekDayClick”, which is now passed after the “dayCount” parameter.
- Added a new “count” parameter for the event “onStatisticClick”, which is now passed after the “colorRange” parameter.
v4.3.1 (03/18/2025)
- Added a new border to the left side of the main UI to make the control stand out a bit more.
- The drop-down menus in the default dark view are now easier to see against the background.
- The day names in the “Map” view remain visible on smaller screens.
v4.3.0 (03/07/2025)
- Updated all the NPM packages to the latest versions.
- Updated SASS usages of import to use (with minor accessor updates).
- Scroll bars are now only shown when required for the views, and are styled using the default theme colors.
- Fixed an issue that caused scroll bars to appear when not required.
v4.2.2 (10/14/2024)
- UI improvements and fixes
v4.2.1 (09/02/2024)
- UI improvements and fixes
v4.2.0 (08/20/2024)
- UI improvements and fixes
- Added new options
v4.1.1 (07/25/2024)
- UI improvements and fixes
v4.1.0 (07/18/2024)
- Code improvement
- Add more options
v4.0.5 (07/16/2024)
- Improvement
v4.0.4 (07/09/2024)
- Added a “build-all” script option so that everything (including minimized versions) can be built with one command.
- Minor CSS layout improvements.
- Removed deprecated “cancelBubble” usages and replaced them with “stopPropagation()”.
- Rewritten “getStyleValueByName()” to use the modern implementation to get a style.
- Fixed a type mismatch between the PublicApi structure and the implementation.
- Improved more type implementations.
- Internal storage date methods are now exported via the “DateTime.ts” module.
- The “import” public API function will now show the select files dialog if no files are passed.
v4.0.3 (07/06/2024)
- Improvements
v4.0.2 (07/06/2024)
- Bugfixes
v4.0.1 (07/04/2024)
- Bugfixes
v4.0.0 (07/04/2024)
- Rewritten in TypeScript
v3.2.0 (06/17/2024)
- Added new options and methods.
- Added export support
v3.1.2 (05/31/2024)
- All text translations now allow empty text to be passed (which will prevent them from defaulting to the English version).
v3.1.1 (05/07/2024)
- Added more options.
- Fixed bugs.
v3.1.0 (04/02/2024)
- Added more options.
v3.0.0 (03/29/2024)
- Added more options.
- CSS renames to ensure they do not collide with other libraries, along with internal refactoring.
- Added a new configuration icon to the main display, which will allow the Days/Months to be toggled easily per view!
- Added a brand new view called “Days”, which will allow you to see the counts for the days of the week for the entire year.
- Redesigned the title drop-down menu.
- Fixed bugs.
v2.8.0 (03/18/2024)
- Added more options.
- Added support for import from CSV
v2.7.2 (03/18/2024)
- The “unload” window event has been replaced with “pagehide”
- Added more options
v2.7.1 (03/07/2024)
- Minor improvements
v2.7.0 (03/06/2024)
- New options
- Code improvements.
- Bugfixes.
v2.6.0 (02/26/2024)
- Added new options, callbacks and methods.
- Code improvements.
- Bugfixes.
v2.5.0 (02/21/2024)
- Added new options, callbacks and methods.
- Added more translations.
- Updated UI
v2.4.0 (02/19/2024)
- Added holiday support
- Added data pulling support
- Added new options and callbacks
- Improved code
v2.3.0 (02/18/2024)
- Added “Import” button
- Added new options
- Bugfixes
v2.2.0 (02/17/2024)
- Export to TXT support
- Added new options
- Changed UI
- Fixed bugs
v2.1.1 (02/15/2024)
- Bugfixes
v2.1.0 (02/13/2024)
- Added file-dropping support to all views, which allows exported JSON data to be re-imported to the currently selected trend type.
- Updated options
- Added new options
v2.0.0 (02/11/2024)
- Added more options
- Added more translations
- Added more themes
- Fixed bugs
- Updated CSS
1.9.2 (02/06/2024)
- Added more options
1.9.0 (02/05/2024)
- Export to XML support
- Add more API
- Code improvement
- Bugfix
1.8.3 (02/04/2024)
- Minor color and layout adjustments
1.8.2 (02/03/2024)
- Added 13 languages
1.8.1 (02/02/2024)
- 15 new languages and fixes
1.8.0 (02/02/2024)
- Added a new “Statistics” view, which shows the total count per map range type (in a bar chart)
- Added label support for the bottom right
- Added more options and API methods
1.7.1 (02/01/2024)
- Bugfixes
1.7.0 (02/01/2024)
- Added export to JSON support
- Added more options and API methods.
- Added more themes
- Updated CSS
1.6.4 (01/30/2024)
- Bugfix
1.6.3 (01/30/2024)
- Update
1.6.2 (01/29/2024)
- Added hover effect for the guide day toggles that are turned off.
1.6.1 (01/29/2024)
- Bugfixes
1.6.0 (01/29/2024)
- Added more options and API methods.
- Added custom tooltip support!
1.5.1 (01/27/2024)
- Added more options
- Bugfixed
1.5.0 (01/25/2024)
- Added more options
- Updated CSS
- Optimized code
1.4.0 (01/23/2024)
- Added more options
- Added more API methods
- Updated CSS
1.3.0 (01/23/2024)
- Added more options
- Added more methods
1.2.1 (01/22/2024)
- Fixed a minor fault that caused the month names to be centred.
- Fixed the day name labels shown on the right, so are now the same height/margin as the days, allowing them to align correctly.
- Added new “:root” variable “–heat-js-border-size-day”, which states the size to use the days/day name heights.
- Fixed the day name labels not being aligned to the middle vertically.
- Increased the default size of the days from 0.85rem to 1.1rem.
- The day names are now hidden in mobile view.
- The type/guide toggles are now stacked in mobile view and centred (make them much easier to access and see).
- The export/refresh buttons are now hidden in mobile view.
- Added new “:root” variable “–heat-js-button-text-color”, which will allow you to override the button text colors.
- The light mode theme buttons now use a darker background color (so they stand out).
- Added the button margin back in for the test files.
1.2.0 (01/19/2024)
- Added new options
- Updated CSS
- Added new themes
1.1.0 (01/19/2024)
- Added more languages
1.0.0 (01/18/2024)
- Added new options and callbacks
- Bugfixes
0.9.0 (01/17/2024)
- Added new options and callbacks
- Added new CSS variables
0.8.0 (01/17/2024)
- Added new options and callbacks
- The heat map layout is now fully responsive with mobile and tablet views.
- When exporting the map details, the type selected is now included in the filename (if types are available).
0.7.0 (01/15/2024)
- All “:root” variables now start with “–heat-js-“, which will prevent collisions with other libraries.
0.6.0 (01/14/2024)
- Added Trend types support
- The “More” and “Less” labels can now be clicked
- Renamed the “year” CSS class to “title-bar”
- Bugfix
0.5.0 (01/11/2024)
- The heat map can now export all data to a CSV file
- Added new options and methods.
0.4.0 (01/11/2024)
- Added new options and methods.
See Also:
 Responsive CSS Chart Library For Web – Neo Charts
 Simple Heat Map Generator with JavaScript and Canvas – Simpleheat
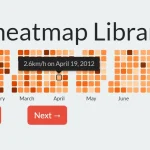 Customizable And Extensible Calendar Heatmap Library – cal-heatmap
 Easy Calendar Heatmap Web Component – contributions-calendar.js
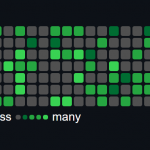 Github Style Contribution Graph In JavaScript – Heatmap.js
 Create A Scroll Position Heat Map using JS and Canvas – ViewHeatmap.js
 Password Visibility Toggler In Vanilla JavaScript
 Versatile Interactive SVG Chart Library – apexcharts.js