


MK Charts is a zero-dependency JavaScript library for drawing circular charts (progress bars) to visualize the percentage data you specify.
See Also:
How to use it:
1. Insert the MK Charts’ JavaScript and CSS into the document.
<link rel="stylesheet" href="css/mk_charts.css" />
<script src="js/mk_charts.js"></script>
2. Create a basic percentage circle and determine the percent value in the data-percent attribute.
<div class="mkCharts" data-percent="35"></div>
3. Specify the color of the circle.
<div class="mkCharts" data-percent="45" data-color="#654321"></div>
4. Set the size of the circle.
<div class="mkCharts" data-percent="45" data-size="125"></div>
5. Set the width of the stroke.
<div class="mkCharts" data-percent="45" data-stroke="3"></div>
See Also:
 Pure CSS Progress Bar Library with Custom Themes – progress-bar.css
 Modern TypeScript Progress Bar Library – BProgress
 3D Liquid Progress Bar in Pure CSS/CSS3
 Easy Scroll Position Tracking – ScrollProgress.js
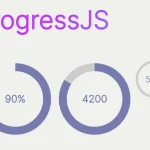 Visualize Progress Data With Animated, Circular Progress Bars – ProgressJS
 Radial Progress Indicator For Click-and-hold Actions – HoldCircleJS
 Simple Scroll Progress Indicator For Long Pages – PageBar.js
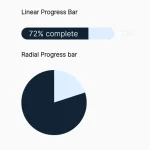 Generate Linear & Radial Progressbars Using CSS – Progress.css
How can you reset the animation when scrolled up or down?