


rpie.js is a tiny yet configurable chart library to render Pie/Donut/Ring charts on an HTML5 canvas element.
How to use it:
1. Load the rpie.js library in the HTML file.
<script src="rpie.js"></script>
2. Create a canvas on where you want to draw the chart.
<canvas id="myCanvas" width="300" height="300"></canvas>
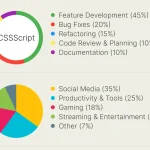
3. Generate a basic pie chart and define an array of values & colors for slices.
generatePieGraph('myCanvas', {
  values: [15, 50, 20, 85, 30],
  colors: ['#4CAF50', '#00BCD4', '#E91E63', '#FFC107', '#9E9E9E']
});
4. Customize the chart with the following parameters.
generatePieGraph('myCanvas', {
  // Enable/disable the animation
  animation: true,
  // Animation speed
  animationSpeed: 20,
  // Shows value & text
  fillTextData: true,
  // Text color
  fillTextColor: '#fff',
  // Higher values gives closer view to center
  fillTextAlign: 1.85,
  // 'horizontal' or 'vertical' or 'inner'
  fillTextPosition: 'horizontal',
  // Percentage of doughnut size
  doughnutHoleSize: null,
  // Doughnut color
  doughnutHoleColor: '#fff',
  // Offeset between two segments & default value is null
  offset: 1,
  // or 'stroke' (ring chart)
  pie: 'normal',
  // Stroke pie options
  isStrokePie: {
    stroke: 20, // Define the stroke of pie graph. It takes number value & default value is 20
    overlayStroke: true, // Define the background stroke within pie graph. It takes boolean value & default value is false
    overlayStrokeColor: '#eee', // Define the background stroke colour within pie graph & default value is #eee (Grey)
    strokeStartEndPoints: 'Yes', // Define the start and end point of pie graph & default value is No
    strokeAnimation: true, // Used for animation. It takes boolean value & default value is true
    strokeAnimationSpeed: 40, // Used for animation speed in miliisecond. It takes number & default value is 20ms
    fontSize: '60px', // Used to define text font size & default value is 60px
    textAlignement: 'center', // Used for position of text within the pie graph & default value is 'center'
    fontFamily: 'Arial', // Define the text font family & the default value is 'Arial'
    fontWeight: 'bold' //  Define the font weight of the text & the default value is 'bold'
  }
});
See Also:
 Lightweight Pie/Donut Charts with CSS Conic Gradients – Pietry
 Lightweight Responsive SVG Charts with CSS Transitions – Beaned-Charts
 Minimal SVG Donut/Pie Chart Generator – donut.js
 Minimal Pie & Ring (Donut) Chart JavaScript Library – Charty
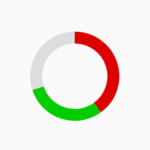 Minimal Doughnut Chart With JavaScript And SVG – donut-chart.js
 High-Performance WebGPU Charting Library for Large Datasets – ChartGPU
 Basic Pie Chart In Pure JavaScript – ChartJS
 Minimal Bar/Line/Pie Chart JavaScript Library – Chartly.js