| Author: | boatx |
|---|---|
| Views Total: | 81 views |
| Official Page: | Go to website |
| Last Update: | December 1, 2024 |
| License: | MIT |
Preview:

Description:
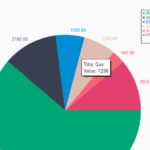
A minimal data plotting library that lets you render a basic pie chart on an HTML5 canvas element.
How to use it:
1. Insert the core JavaScript chartjs.js into the HTML file.
<script src="chartjs.js">
2. Create an empty canvas element on the page.
<canvas width="800" height="800" id="example">
  Sorry, canvas not supported
</canvas>
3. Define slices and numerical proportions for the pie chart.
var skills = {
    javascript: 0.3,
    html: 0.6,
    css: 0.1
};
4. Define colors for slices.
var colors = {
    javascript: 'green',
    html: 'blue',
    css: 'red'
};
5. Draw a pie chart on the page.
var canvas = document.getElementById('example');
var chart = chartJS.PieChart(elements, colors, canvas);
chart.draw();
Changelog:
v4.4.7 (12/01/2024)
- Export TRBL from geometric
- Bugfix
v4.4.6 (10/28/2024)
- Fix: applyStack() returned the sum of all values for hidden dataset indices, which causes incorrect animations when showing/hiding stacked datasets.


