


Charty is a tiny yer customizable JavaScript library that helps draw pie and ring charts (also called donut charts or circle charts) using plain JavaScript and CSS. No SVG and Canvas required.
How to use it:
1. Add the Charty’s JavaScript and Stylesheet to the page.
<link rel=”stylesheet” href=”./charty.css” />
<script src=”./charty.js”></script>
2. Generate a ring chart from the data you provide:
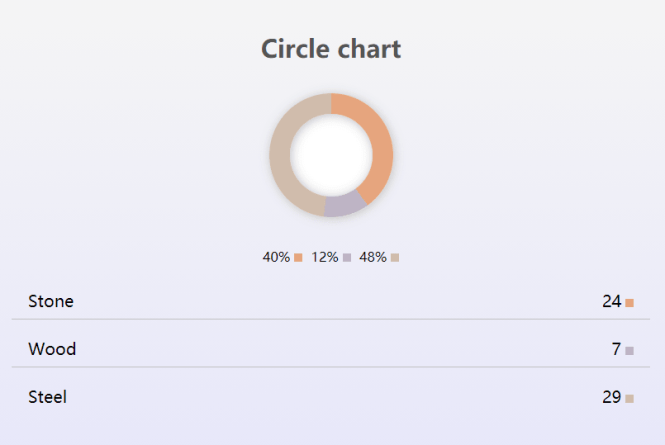
const chart = new Charty({
  title: 'Chart Title',
  data: [
    {Stone: 24},
    {Wood: 7},
    {Steel: 29}
  ]
});
3. Generate a pie chart from the data you provide.
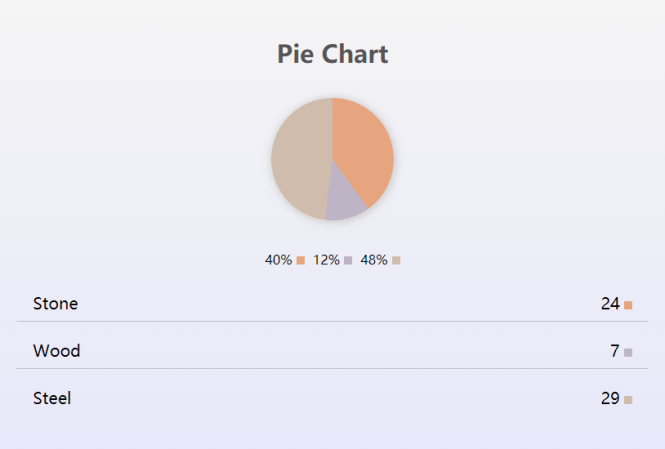
const another = new Charty({
  title: 'Pie Chart',
  data: [
    {Stone: 24},
    {Wood: 7},
    {Steel: 29}
  ],
  chartType: 'pie'
});
4. All default parameters:
- title: The title of the chart
- chartType: The type of chart circle|pie
- data: An array of objects in the pair format: name/vale {name: value}
- precision: Determines whether the chart have decimal precision or not
- selector: The html element where the chart will be insert, must be a valid css selector
new Charty({
  title = 'New Chart',
  chartType = 'circle',
  data = [{Test: 5}],
  precision = false,
  selector = 'body'
});
5. Add more data to the chart.
chart.addData({
  "Name", Value
});
See Also:
 Lightweight Pie/Donut Charts with CSS Conic Gradients – Pietry
 Lightweight Responsive SVG Charts with CSS Transitions – Beaned-Charts
 Minimal SVG Donut/Pie Chart Generator – donut.js
 Animated Pie/Donut/Ring Chart With Canvas And JavaScript – rpie.js
 High-Performance WebGPU Charting Library for Large Datasets – ChartGPU
 Basic Pie Chart In Pure JavaScript – ChartJS
 Minimal Bar/Line/Pie Chart JavaScript Library – Chartly.js
 Single Element Pie Chart (Circle Diagram) With CSS
I loved how you have provided so many dats to add in the Chart JavaScript. Just now i realize i was adding wrong data’s for so long and that is why it wasn’t working properly. Thanks for sharing.
smart, effective and light : perfect for me