Minimal Hexagon Chart With JavaScript And Canvas – HexChart

HexChart is a very small JavaScript library which helps you draw a hexagon chart on an HTML5 canvas element.


HexChart is a very small JavaScript library which helps you draw a hexagon chart on an HTML5 canvas element.

A tiny yer customizable JavaScript library that helps draw pie and ring charts using plain JavaScript and CSS.

A JavaScript library for drawing customizable, single- or multi-line charts using SVG.

Draws animated customizable network diagrams on a canvas element to visually present networks of connected nodes and links.

A zero-dependency JavaScript library for drawing circular charts (progress bars) to visualize the percentage data you specify.

diagramflowjs is a JavaScript library to draw an interactive, editable flowchart representing workflows, decisions, complex process, and much more.

TChart.js is a tiny (~5kb minified) JavaScript charting library to generate a canvas-based bar (column) or line chart from an array of JS objects.

A minimal JavaScript charting library that takes an array of JS objects and converts them into a simple column chart using plain JavaScript/HTML/CSS.
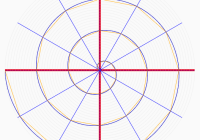
A JavaScript library to draw an archimedean spiral with Bezier Curve and SVG.

A pure CSS solution to create a responsive, nice-looking organization & family graph using CSS Grid Layout and nested HTML list.