Interactive SVG Polygon Graph In JavaScript – PolygonChart.js

PolygonChart.js is a JavaScript library to dynamically generate customizable, SVG based polygon graphs from an array of numeric data you provide.


PolygonChart.js is a JavaScript library to dynamically generate customizable, SVG based polygon graphs from an array of numeric data you provide.
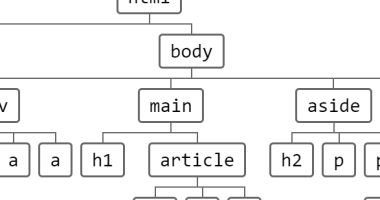
A Pure CSS solution to generate a pretty clean tree diagram from nested HTML lists.
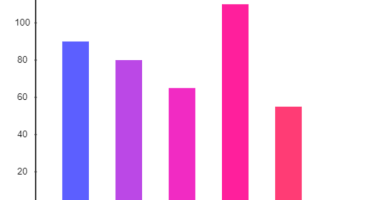
rbar.js is a tiny JavaScript bar chart plugin to render animated, highly customizable column chart with labels & scales using plain JavaScript and HTML5 canvas.

pie-chart-js is a small JavaScript component to render a simple, plain, responsive pie chart using HTML5 canvas and Custom Element.

rpie.js is a tiny yet configurable chart library to render Pie/Donut/Ring charts on an HTML5 canvas element.

mimaCharts is a JavaScript library for rendering responsive, interactive, various types of charts/graphs following the Google Material Design guidelines.
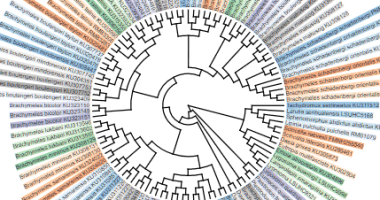
Treelib is a vanilla JavaScript phylogenetic tree library that lets you render Newick Tree and Nexus Tree using JavaScript and SVG.
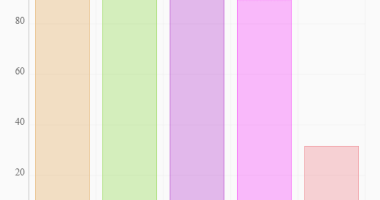
bar-js is a small, flexible, dynamic JavaScript chart plugin to draw minimal clean bar & column charts on a canvas element.

jsdragblocks is a JavaScript to visualize the relationship between two block elements by creating directional arrows between nodes via drag and drop.

Pinker.js is a vanilla JavaScript library which renders a canvas based flow chart from plain text to represents a workflow, process, or decisions.