Generate SVG-based Flowcharts From JSON Data – jsontr.ee

A JavaScript library to visualize JSON as tree diagrams (flowhcharts). Supports nested objects, arrays, and custom styles for clear data representation.


A JavaScript library to visualize JSON as tree diagrams (flowhcharts). Supports nested objects, arrays, and custom styles for clear data representation.

Convert correlation data into visual matrices with circle size and color encoding. Uses JavaScript and HTML5 Canvas for clear data representation.

A lightweight SVG scalebar web component. Create customizable, responsive data visualizations with support for complex color schemes and flexible layouts.
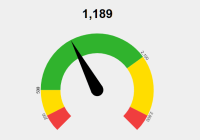
A powerful JavaScript library to render customizable, animated gauges on an HTML5 canvas element.

A robust JavaScript library for generating responsive, dynamic, animated, interactive, SVG-based graphs and charts.

Drawflow is a JavaScript library to dynamically generate a pretty flowchart via drag and drop.

A lightweight JavaScript library for basic charts. Create bar, line, and pie charts quickly.

Simpleheat is a simple and fast heat map visualization library which allows you to draw Html5 canvas based heat maps with ease.

treeMaker is a JavaScript library that renders a tree-like diagram from JSON or JS objects to show the structure and the relationship in an organization/agency/family.

A lightweight JavaScript library that provides an easy way to visualize hierarchical data in appealing and customizable tree views. Zero dependencies.