


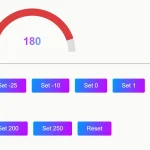
A powerful JavaScript library to render customizable, animated gauges on an HTML5 canvas element.
How to use it:
1. Download and import the Gauge.js into the document.
<script src="dist/gauge.js"></script>
2. Create an HTML5 canvas element to hold the gauge.
<canvas id="demo"></canvas>
3. Create an element to hold the current value.
<div id="preview-textfield"></div>
4. Create a new gauge instance.
var opts = {
    // options here
};
var target = document.getElementById('demo');
var gauge = new Gauge(target).setOptions(opts);
5. Display the current value in the text field.
document.getElementById("preview-textfield").className = "preview-textfield";
gauge.setTextField(document.getElementById("preview-textfield"));
6. Set min/max/current values.
gauge.maxValue = 3000;
gauge.setMinValue(0);
gauge.set(1250);
7. Set animation speed.
gauge.animationSpeed = 32
8. All default options to config the gauge.
var opts = {
    // color configs
    colorStart: "#6fadcf",
    colorStop: void 0,
    gradientType: 0,
    strokeColor: "#e0e0e0",
    generateGradient: true,
    percentColors: [[0.0, "#a9d70b" ], [0.50, "#f9c802"], [1.0, "#ff0000"]],
    // customize pointer
    pointer: {
      length: 0.8,
      strokeWidth: 0.035,
      iconScale: 1.0
    },
    // static labels
    staticLabels: {
      font: "10px sans-serif",
      labels: [200, 500, 2100, 2800],
      fractionDigits: 0
    },
    // static zones
    staticZones: [
      {strokeStyle: "#F03E3E", min: 0, max: 200},
      {strokeStyle: "#FFDD00", min: 200, max: 500},
      {strokeStyle: "#30B32D", min: 500, max: 2100},
      {strokeStyle: "#FFDD00", min: 2100, max: 2800},
      {strokeStyle: "#F03E3E", min: 2800, max: 3000}
    ],
    // render ticks
    renderTicks: {
      divisions: 5,
      divWidth: 1.1,
      divLength: 0.7,
      divColor: #333333,
      subDivisions: 3,
      subLength: 0.5,
      subWidth: 0.6,
      subColor: #666666
    }
    // the span of the gauge arc
    angle: 0.15,
    // line thickness
    lineWidth: 0.44,
    // radius scale
    radiusScale: 1.0,
    // font size
    fontSize: 40,
    // if false, max value increases automatically if value > maxValue
    limitMax: false,
    // if true, the min value of the gauge will be fixed
    limitMin: false,
    // High resolution support
    highDpiSupport: true
};
Changelog:
v1.3.9 (10/23/2024)
- Bugfixes
See Also:
 Minimal JavaScript Gauge Library: No SVG/Canvas
 Responsive CSS Chart Library For Web – Neo Charts
 Create Minimal Dial Gauges With JavaScript And SVG
 Canvas-based JavaScript Knob/Dial Component – pure-knob
 Minimal Gauge Meter In Pure CSS
 Canvas Based HTML5 Gauge Library – Gauge.js
 Create Animated Gauges With JavaScript – SVG Gauge
 Two-dimensional Gauge Component With JS And SVG – DoubleGauge
Gauge not showing when i open it on mobile browser, but run smoothly on desktop, why ?