


jsvectormap is a vanilla JavaScript library that creates interactive SVG vector maps in the browser.
You can use it to generate clickable world, country, and regional maps with markers, labels, tooltips, zoom controls, lines, and data-based region colors.
Features:
- SVG-based world, country, and regional maps.
- Clickable regions with hover, selected, and selected-hover states.
- Markers on latitude and longitude coordinates.
- Labels and tooltips for regions and markers.
- Draw straight, animated, or curved lines between markers.
- Color regions from data values with a custom scale.
- Control pan, zoom, scroll zoom, touch input, and zoom buttons.
- Update selections, markers, lines, background color, and map size from JavaScript.
How to use it:
Installation
For direct browser usage, load the stylesheet, the core library, and at least one map data file.
<link rel="stylesheet" href="https://cdn.jsdelivr.net/npm/jsvectormap/dist/jsvectormap.min.css" />
<script src="https://cdn.jsdelivr.net/npm/jsvectormap"></script>
<script src="https://cdn.jsdelivr.net/npm/jsvectormap/dist/maps/world.js"></script>
For a bundler-based project, install the package and import the CSS and map data.
npm install jsvectormap
import jsVectorMap from 'jsvectormap';
import 'jsvectormap/dist/jsvectormap.min.css';
import 'jsvectormap/dist/maps/world';
Basic usage
Create a visible container for the map. The map needs container dimensions before initialization.
<div id="sales-map" style="width: 100%; height: 420px;"></div>
Initialize jsvectormap with a selector and a loaded map name.
const map = new jsVectorMap({
  selector: '#sales-map',
  map: 'world'
});
Load another built-in map
Load the required map file before you call the constructor. The map value must match that map data file.
<script src="https://cdn.jsdelivr.net/npm/jsvectormap/dist/maps/us-merc-en.js"></script>
<script>
const map = new jsVectorMap({
  selector: '#state-map',
  map: 'us_merc_en'
});
</script>
Available map names include world, world_merc, us_mill_en, us_merc_en, us_lcc_en, us_aea_en, spain, russia, canada, iraq, and brasil.
Add markers and marker labels
Markers use latitude and longitude coordinates. The marker name can also act as the label text and the line connection key.
const officeMarkers = [
  { name: 'New York', coords: [40.7128, -74.0060] },
  { name: 'London', coords: [51.5072, -0.1276] },
  { name: 'Tokyo', coords: [35.6762, 139.6503] }
];
const map = new jsVectorMap({
  selector: '#office-map',
  map: 'world',
  markers: officeMarkers,
  markersSelectable: true,
  labels: {
    markers: {
      render(marker) {
        return marker.name;
      }
    }
  }
});
You can add markers after the map loads.
map.addMarkers({
  name: 'Sydney',
  coords: [-33.8688, 151.2093],
  style: {
    initial: {
      fill: '#d97706'
    }
  }
});
Select regions and read selected values
Region selection uses map region codes. This pattern works for dashboards, filters, and reports that need a selected country or state list.
const map = new jsVectorMap({
selector: '#region-map',
map: 'world',
regionsSelectable: true,
selectedRegions: ['US', 'CA'],
regionStyle: {
selected: {
fill: '#2563eb'
}
},
onRegionSelected(code, isSelected, selectedRegions) {
console.log(code, isSelected, selectedRegions);
}
});
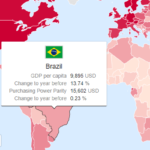
console.log(map.getSelectedRegions());Customize tooltips
Tooltip callbacks let you replace or extend the text shown for a region or marker.
const map = new jsVectorMap({
  selector: '#tooltip-map',
  map: 'world',
  showTooltip: true,
  onRegionTooltipShow(event, tooltip, code) {
    if (code === 'US') {
      tooltip.selector.innerHTML = tooltip.text() + ' <strong>Market data</strong>';
    }
  },
  onMarkerTooltipShow(event, tooltip, markerIndex) {
    tooltip.selector.innerHTML = '<strong>' + tooltip.text() + '</strong>';
  }
});
Draw lines between markers
Lines connect markers by marker name. Use them for routes, flows, relationships, or location-to-location links.
const map = new jsVectorMap({
  selector: '#route-map',
  map: 'world',
  markers: [
    { name: 'New York', coords: [40.7128, -74.0060] },
    { name: 'London', coords: [51.5072, -0.1276] },
    { name: 'Tokyo', coords: [35.6762, 139.6503] }
  ],
  lines: [
    { from: 'New York', to: 'London' },
    { from: 'London', to: 'Tokyo' }
  ],
  lineStyle: {
    stroke: '#6b7280',
    strokeWidth: 1.5,
    strokeDasharray: '6 3',
    animation: true,
    curvature: -0.5
  }
});
Add or remove lines from an existing map instance.
map.addLines({ from: 'New York', to: 'Tokyo' });
map.removeLines([{ from: 'London', to: 'Tokyo' }]);
map.removeLines();
Color regions from data values
The visualizeData option maps numeric values to a color scale for region-based data visualization.
const map = new jsVectorMap({
  selector: '#traffic-map',
  map: 'world',
  visualizeData: {
    scale: ['#dbeafe', '#1d4ed8'],
    values: {
      US: 100,
      CA: 58,
      BR: 42,
      DE: 75,
      JP: 64
    }
  }
});
All Configuration options
selector(string): Target element for the rendered map.map(string): Loaded map name, such asworldorworld_merc.backgroundColor(string): Background color for the map container.draggable(boolean): Toggles map dragging.zoomButtons(boolean): Shows or hides zoom buttons.zoomOnScroll(boolean): Toggles wheel-based zoom.zoomOnScrollSpeed(number): Sets wheel zoom speed.zoomMax(number): Sets the maximum zoom scale.zoomMin(number): Sets the minimum zoom scale.zoomAnimate(boolean): Toggles animated zoom changes.showTooltip(boolean): Shows tooltips for regions and markers.zoomStep(number): Sets the step size for zoom in and zoom out actions.bindTouchEvents(boolean): Toggles touch event binding for touch devices.focusOn(object): Focuses the initial viewport on one or more regions.markers(array): Defines markers loaded during initialization.selectedMarkers(array): Defines initially selected marker indexes.markersSelectable(boolean): Lets users select markers.markersSelectableOne(boolean): Restricts marker selection to one marker.markerStyle(object): Controls marker styles for initial, hover, selected, and selected-hover states.markerLabelStyle(object): Controls marker label styles.selectedRegions(array): Defines initially selected region codes.regionsSelectable(boolean): Lets users select regions.regionsSelectableOne(boolean): Restricts region selection to one region.regionStyle(object): Controls region styles for initial, hover, selected, and selected-hover states.regionLabelStyle(object): Controls region label styles.labels(object): Defines marker or region label render functions.lines(array): Defines marker-to-marker line connections.lineStyle(object): Controls line stroke, dash pattern, animation, and curvature.series(object): Defines marker or region series rules.visualizeData(object): Maps region values to a color scale.
API methods
// Set the map container background color.
map.setBackgroundColor('#f8fafc');
// Return selected region codes.
map.getSelectedRegions();
// Clear selected regions.
map.clearSelectedRegions();
// Set selected regions after initialization.
map.setSelectedRegions(['US', 'GB']);
// Return selected marker indexes.
map.getSelectedMarkers();
// Clear selected markers.
map.clearSelectedMarkers();
// Set selected marker indexes after initialization.
map.setSelectedMarkers([0, 2]);
// Add one marker or an array of markers.
map.addMarkers({ name: 'Berlin', coords: [52.52, 13.405] });
// Remove selected marker indexes or remove all markers.
map.removeMarkers([1, 3]);
map.removeMarkers();
// Add one line or an array of lines.
map.addLines({ from: 'New York', to: 'London' });
// Remove selected lines or remove all lines.
map.removeLines([{ from: 'New York', to: 'London' }]);
map.removeLines();
// Recalculate the map size after layout changes.
map.updateSize();
// Reset the map viewport and state.
map.reset();
// Add a custom method to the map instance.
map.extend('$highlightMarket', function (options) {
  const map = this;
});
// Remove the map, tooltip, and attached event listeners.
map.destroy();
Event handlers
const map = new jsVectorMap({
  selector: '#event-map',
  map: 'world',
  onLoaded(map) {
    window.addEventListener('resize', function () {
      map.updateSize();
    });
  },
  onViewportChange(scale, transX, transY) {
    console.log(scale, transX, transY);
  },
  onRegionClick(event, code) {
    console.log('Region clicked:', code);
  },
  onMarkerClick(event, markerIndex) {
    console.log('Marker clicked:', markerIndex);
  },
  onRegionSelected(code, isSelected, selectedRegions) {
    console.log(code, isSelected, selectedRegions);
  },
  onMarkerSelected(index, isSelected, selectedMarkers) {
    console.log(index, isSelected, selectedMarkers);
  },
  onRegionTooltipShow(event, tooltip, code) {
    console.log('Region tooltip:', code);
  },
  onMarkerTooltipShow(event, tooltip, markerIndex) {
    console.log('Marker tooltip:', markerIndex);
  }
});
Implementation tips
- Load the core library before the map data file when you use script tags.
- Use the same map name in the constructor that the loaded map file registers.
- Set a width and height on the map container before initialization.
- Call
updateSize()after the map appears inside a hidden tab, modal, accordion, or resized layout. - Use marker
namevalues consistently when you draw lines between markers. - Use
addLines()andremoveLines()for new code because the singular line methods are deprecated.
Related Resources:
- Interactive SVG World Map Library
- SVG World Map With Countries, Provinces, And States
- 3D Globe With Dotted World Map Using WebGL
- CSS-Only Country Flags in a Single Element (110 Flags Included)
- Google Maps Location Picker
FAQs:
Why does the map render too small or not appear?
Check the container dimensions first. The target element needs a visible width and height before the map renders.
How do I handle region click and tooltip behavior?
Use onRegionClick for click behavior and onRegionTooltipShow to change tooltip content before it appears.
Can jsvectormap show values by country?
Yes. Use visualizeData with a color scale and an object whose keys match region codes.
Changelog:
v1.7.0 (06/12/2024)
- feat(maps): add Brazil map
- feat: add setSelectedMarkers and fix element events
- refactor: rename jsvectormap.js to jsvectormap.esm.js
- refactor: drop class definition comment from classes
- feat(lines): add curved lines with curvature option
- fix(lines): programmatic creation of lines fails
- refactor: enhance marker and line components
- refactor: replace deprecated pageY/XOffset with scrollY/X
- chore: replace class with id
- fix: hide tooltip via prevent default
- feat: support ability to customize zoom buttons
- fix: panning to scroll on mobile devices #171
- refactor: missing using zoomInOption variable
- fix: tooltip might be undefined see
- refactor: use css variables to override style
- fix(tooltip): internal text overrides text from listeners
- revert: revert old lineStyle config to maintain compatibility
- fix(lines): curves distorted when it’s zero value
- refactor: enhance style and drop unwanted props
v1.6.0 (06/12/2024)
- feat(maps): create the build maps script
- feat(regions): set/clear selected regions programmatically
- fix(markers): add markers method
- chore: drop internet explorer entirly
- fix(visualization): NAN value is encountered when min and max are the same
- feat: allow all styles in add markers
- feat: refactor: support umd, es and cjs format
v1.5.2 (04/07/2023)
- fix(markers): get/clear selected markers
- fix: series doesn’t receive markers nor regions
- fix(events): tooltip fails when it’s disabled
- perf: massively improves performance when not using labels
- style: replace let with const for the sake of consistency
- refactor: abstract the zoom handlers
- style: replace let with const
- style: imporve variable declaration
- fix: zoom on mobile
- refactor: replace jsvectormap.js with index.js
v1.5.1 (08/16/2022)
- refactor: improve consistency & readbility
v1.5.0 (07/10/2022)
- feat(events): onRegion/MarkerClick support
- fix: shaky click selects a region
- fix: lines reposition fails
- refactor: improve the destroy method
- refactor: build an abstract class for components
- refactor: improve consistency & remove addMarker entirely
- feat: ability to remove a line or multiple lines
- refactor: better name conventions
- refactor: move elements to components
- refactor: get selector from merged options directly
- fix: too much recursion error
- feat(lines): ability to remove lines
- fix(typo): ‘tranparent’ typo in default options
v1.4.4 (02/09/2022)
- fix: lines position fail when zooming in/out
v1.4.3 (02/01/2022)
- refactor: switch addMap, maps, defaults to static
- revert: revert tooltip’s css method
- fix: touch handlers
- chore: cleaning up
- fix: marker’s render function
v1.4.2 (11/21/2021)
- fix: tooltip not destroyed
v1.4.0 (11/21/2021)
- refactor: drop dom handler class
- refactor: move tooltip functionality to class
- fix: fix mouseup event & fix zoom buttons
- refactor: clean up util API
- refactor: refactor directory structure
- fix: fix ‘addMarkers’ method doesn’t work with arrays
- fix(scroll): fix mouse wheel behavior
v1.3.3 (09/02/2021)
- fix: dragging the map selects the region
- fix: eventHandler’s off method doesn’t delete the reference
- style: correct events names for consistency
- feat: introduce a new event ‘onDestroyed’
- fix(add-markers): add markers method not working with object
v1.3.1 (06/16/2021)
- Update
v1.3.0 (01/18/2021)
- Deep refactor for jsvectormap that improves code structure and removing some unwanted code blocks
- Implement data visualization feature
- Ability to animate lines
v1.2.0 (12/29/2020)
- Add support for drawing lines between markers
- Fix simple issue with line class
- Feat(add-line): ability to create lines after map initialization.
v1.2.0 (12/29/2020)
- feat(destroy): added destroy method
See Also:
 Interactive SVG World Map Library – svgMap.js
 Cobe: 3D Globe With Dotted World Map Using WebGL
 SVG World Map With All Countries, Provinces, And States
 iPhone 5S Website-Like One Page Scrolling Effect with Javascript and CSS3
 Responsive Hamburger Menu In Pure CSS
 Copy Text To Clipboard with Single Click – Clipboard Button
 Text Avatar Generator With JavaScript And SVG – UI Avatar SVG
 Touch-enabled Carousel With Kinetic Scrolling Effect
hi, is it possible to redirect when I click a country? thanks
You can try and tweak this jQuery.
“
$(‘#map-wrapper g path’).each(function () {
var countryCode = $(this).attr(‘data-code’);
$(this).click(function(e){
e.preventDefault();
// Will open url in this format
//https://mywebsite/center/?country=us
window.location = “https://mywebsite/center/?country=”+countryCode;
});
});
“
Note that you can also use dlclick() for double click event instead of single click
Where exactly would I place this script to allow a redirect when a country is clicked?
What is Palestine? Did you mean Israel?
There is no such thing as israel!!
how to load or bind data dynamically in world map?
I am not able to bind dynamic data in world map. please help me on that.
Im not able to even get it working to display the map.
I take it the index file should display a map, it just saids”Jsvectormap workspace.
Here you can test the maps and find out how it works if you want to contribute to Jsvectormap fork this repository.. etc.” and then there is a link.
Hi! i am trying to use the map, but the downloaded file does not work. Same problem as spinner – i think the jsvectormap.js file is missing from the js folder. I am a noob to coding, so manybe i am doing something wrong. But your own index.html file doesnt not display the map.
Thanks for any advice/help.
Fixed! Thanks a lot for your feedback.
marker popup not working. can anyone please help me on this?