


A JavaScript library to render an SVG-based world map with all countries, provinces, and states on the website.
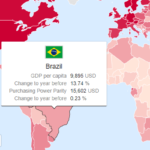
Ideal for visualizing any global data (e.g. COVID-19, GDP, Demographic) in a graphic style.
Basic usage:
1. Download and load the main JavaScript file svg-world-map.js in the document.
<script src="svg-world-map.js"></script>
2. Embed an SVG world map into your document.
<object id="svg-world-map" data="world-states-provinces.svg" type="image/svg+xml"></object>
<!-- This also works: <embed id="svg-world-map" src="world-states-provinces.svg" />-->
3. Initialize the world map and done.
var mySVG = document.getElementById('svg-world-map');
    mySVG.addEventListener("load", function() {
      var myWorldMap = svgWorldMap(mySVG);
})
4. Possible options to config the world map.
var myWorldMap = svgWorldMap(mySVG,{
    // Base path
    libPath: '../src/', // Point to library folder, e.g. (http[s]:)//myserver.com/map/src/
    // Basic options
    bigMap: true, // Set to 'false' to load small map without provinces
    showOcean: true, // Show or hide ocean layer
    showAntarctica: true, // Show or hide antarctic layer
    showLabels: true, // Show country labels
    showMicroLabels: false, // Show microstate labels
    showMicroStates: true, // Show microstates on map
    showInfoBox: false, // Show info box
    backgroundImage: '', // Background image path
    // Color options
    oceanColor: '#D8EBFF',
    worldColor: '#FFFFFF',
    labelFill: { out: '#666666',  over: '#333333',  click: '#000000' },
    //countryFill: { out: '#B9B9B9',  over: '#CCCCCC',  click: '#666666' }, // TODO: Currently this makes no sense for main country groups, until all country borders are existing in the SVG (a lot are missing, e.g. Japan, Greenland, Antarctica)
    countryStroke: { out: '#FFFFFF',  over: '#FFFFFF',  click: '#333333' },
    countryStrokeWidth: { out: '0.5',  over: '1',  click: '1' },
    provinceFill: { out: '#B9B9B9',  over: '#FFFFFF',  click: '#666666' },
    provinceStroke: { out: '#FFFFFF',  over: '#FFFFFF',  click: '#666666' },
    provinceStrokeWidth: { out: '0.1',  over: '0.5',  click: '0.5' },
    // Group options
    groupCountries: true, // Enable or disable country grouping
    groupBy: [ "region" ], // Sort countryData by this value(s) and return to countryGroups
    // Coordinates
    trackCoords: false, // Track map coords, default 'false' due to performance
    // Callback functions from the map to the outside, can have custom names
    mapOut: "mapOut",
    mapOver: "mapOver",
    mapClick: "mapClick",
    mapCoords: "mapCoords",
    mapDate: "mapDate", // (Custom) callback function for time control date return
    mapTable: "mapTable", // (Custom) callback function for HTML data parsing
    // Time controls
    timeControls: false, // Set to 'true' for time controls
    timePause: true, // Set to 'false' for time animation autostart
    timeLoop: false //  Set to 'true' for time animation loop
});
Changelog:
v0.2.4 (06/16/2020)
- Added custom background image, added SVG shapes, images and text, added basic coordinate system, modified icon font, minor changes
v0.2.2 (12/29/2020)
- merged time controls module into main library
- added option for library path
- minor changes
v0.2.1 (05/12/2020)
- Minor changes
v0.2.0 (05/04/2020)
- Optimized mobile CSS
- Fixed map loading and info box bug
v0.1.9 (05/03/2020)
- Added map download function for SVG and PNG
- Added details to info box
v0.1.8 (05/01/2020)
- Added Wikipedia time data import.
- Added object conversion to time controls.
v0.1.7 (04/29/2020)
- Fixed pause bug in time controls, minor changes
v0.1.6 (04/27/2020)
- Added optional small SVG world map without provinces
- Moved map initialization to library
- Changed library initialization to async function
- Added mobile detection
- Added showAntarctica to options
- Added demo.css
- Adjusted demos for async load
- Minor changes
v0.1.5 (04/21/2020)
- Added Wikipedia table import
v0.1.4 (04/18/2020)
- Added time controls module to library
See Also:
 Interactive SVG World Map Library – svgMap.js
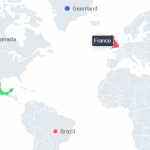 jsvectormap: JavaScript Library For Interactive Vector Maps
 Cobe: 3D Globe With Dotted World Map Using WebGL
 Pure CSS/CSS3 Animated Radial Menu
 Apply Instagram Photo Filters To Images using Pure CSS/CSS3
 Tiny JavaScript Syntax Highlighter
 Responsive & Animated Chart JavaScript Library – RGraph
 Customizable Event Calendar With Month/Year Selection – Color Calendar