


Light table is a simple JavaScript library for building interactive data tables from regular HTML tables.
It has several capabilities that make presenting data easy and intuitive:
- The search feature lets users find what they need by quickly filtering table rows.
- Pagination breaks up long tables over multiple pages for improved load times and readability.
- Sorting columns lets users re-order and prioritize information on the fly.
- Excluding columns from search gives you granular control over the experience.
- Theming options like light and dark modes cater to user preferences for accessibility.
- Exports the table to a CSV file. NEW
- Generates bar or line charts from tables. NEW
How to use it:
1. Download the package and include the light-table.js script on your page.
<script src="/js/light-table.js" ></script>
2. Add the data-sortable attribute to the target table columns which should be sortable.
<table id="table3" >
  <thead>
    <tr>
      <th data-sortable="yes">ID</th>
      <th data-sortable="yes">First Name</th>
      <th>Last Name</th>
      <th>Birth date</th>
      <th data-sortable="yes">Grade</th>
    </tr>
  </thead>
  <tbody>
    ...
  </tbody>
</table>
3. Initialize the LightTable on your HTML table. That’s it.
new LightTable({
    // selector of your html table
    selector : 'table',
    // enable table filtering
    search : true,
    // enable table pagination
    pagination : true,
    // number of pages
    paginationPerPage: 10,
    // stick the table head to the top while scrolling
    stickyHead : true,
    // custom theme CSS
    theme : 'black',
    // export options
    print: false,
    exportCSV: false,
    exportCSVFileName: '',
    // strings
    labels : {
      print : 'Print',
      exportCSV : 'Export CSV',
      searchAnyThing : 'Search any thing'
    }

});
4. Generate a line or bar chart from your table.
new LightTable({
    // selector of your html table
    selector : 'table',
    charts : [
      {
        id : 'bars', // or 'line'
        x : 1, //X column index, 0 for the first
        y : 4, //Y column index
        color: '#c90000',
        hover: true,
        hoverColor: 'blue',
        hideLabel: false,
        horizintalLines: true,
        horizintalLinesColors: '#ccc',
        spacing: 10,
        axisScaleUnit: 5,
        hideAxis: false,
      }
    ]

});
5. Apply your own CSS styles to the Light Table.
/* table styles */
.lt-table table{
  border-collapse: collapse;
}
.lt-table table th,
.lt-table table td{
  padding: 5px;
}
.lt-table.lt-sticky table thead{
  position: sticky;
  top: 0;
  z-index: 1;
}
.lt-table button{
  font-size: 11px;
  width:20px;
  height:20px;
  line-height:20px;
  padding:0;
  border:0;
  margin:0;
  cursor: pointer;
}
.lt-table button.current{
  opacity: 0.8;
}
.lt-table-header{
  display: flex;
  justify-content: space-between;
  margin-bottom: 20px;
}
.lt-table-footer{
  display: flex;
  justify-content: space-between;
}
.lt-table-search {
  display: flex;
  gap: 10px;
}
.lt-table-search input{
  width:200px;
  padding:0 10px;
  height:30px;
  border:1px solid #ccc
}
.lt-table-pagination{
  display: flex;
  gap: 5px;
}
.lt-table-table{
  margin-bottom: 20px;
}
.lt-table th[data-sortable="yes"]{
  cursor: pointer;
  position: relative;
}
.lt-table th[data-sortable="yes"]::after{
  content: '*';
  display: inline-block;
  vertical-align: midd;e;
}
/* add your themes here */
.lt-black table th,.lt-black table td {
  border: 1px solid #000;
}
.lt-black .lt-table-pagination button, .lt-black table thead{
  background-color: #000;
}
.lt-black table tbody *{
  color: #000;
}
.lt-black .lt-table-pagination button, .lt-black table thead *{
  color:#fff;
}
6. Use the lt-exclude-search class to exclude specified cells from search results.
<tr>
  <td>1001</td>
  <td class="lt-exclude-search">Ernst</td>
  <td>Handel</td>
  <td>09/25/2020</td>
  <td>90</td>
</tr>
Changelog:
v1.0.3 (09/25/2023)
- Add CSV export
- Add line/bar charts
See Also:
 High Performance Table Data Presentation Library – regular-table
 Interactive And Customizable Data Table/Grid Web Component – Active Table
 Modern Data Table Library for Web Developers – TablixJS
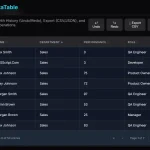 Lightweight Vanilla JS Data Grid for Modern Web Apps – BWDataTable
 Advanced Data Grid/Table Library in Vanilla JavaScript – VanillaGrid
 Build Searchable Data Views from JSON Data with SenangWebs Index
 Vanilla JavaScript Table Enhancement: Search, Sort, Paginate
 Flexible Interactive Data Table In Pure JavaScript – JSTable