


g-chart is a pure Vanilla JavaScript library used to render dynamic HTML5 charts using on the canvas elements. Currently, it supports pie and line charts.
Basic usage:
Load the JavaScript file in the html document.
<script src="g-chart.line.js"></script>
<script src="g-chart.pie.js"></script>
Create your own data, label tooltip arrays to be presented in the pie or line chart.
var data   = [ 12,   15,   13,   22,   8,   12,   31,   3,   5 ];
var label  = ['12', '15', '13', '22', '8', '12', '31', '3', '5'];
var tooltip  = ['Twelve', 'Fifteen', 'Thirteen', 'Twenty-two', 'Eight', 'Twelve', 'Thirdy-one', 'Three', 'Five'];
Create an HTML5 canvas element for the chart.
<canvas id="pie" width="400" height="400"></canvas>
<canvas id="line" width="600" height="400"></canvas>
Generate a pie chart.
var canvas = document.getElementById("pie");
var pie_chart = new PieChart(canvas, data, label, tooltip);
pie_chart.draw();
pie_chart.tooltipOn('mousemove');
Generate a line chart.
canvas = document.getElementById("line");
var line_chart = new LineChart(canvas, data, label, tooltip);
line_chart.draw();
line_chart.tooltipOn('mousemove');
Customize the tooltip using your own CSS styles.
.tooltip-chart {
  position: fixed;
  z-index: 1000;
  transform: translate(-50%, -120%);
  padding: 10px;
  background-color: white;
  border-radius: 5px;
  text-align: center;
  min-width: 100px;
  border: 1px solid #000;
  box-shadow: 0 0 10px 5px #000;
}
See Also:
 Simple Extensible Code Editor – Copenhagen
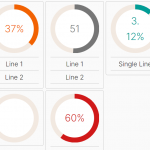 Simple Plain Circle Progress Bar Library – ProgressCircle.js
 Elegant Flexible Image Lightbox Gallery Library – Lightbox V
 Tags Input Based On HTML Data List – multi-input.js
 Stylish Off-canvas Side Menu with JS and CSS
 Minimalist Countdown Timer with timerJS.js
 Easy Syntax Highlighting Library – CSPSH.js
 JS Array To CSV Exporter And CSV To Table Converter – CSVx.js