


jsGantt is a customizable, flexible, multilingual Gantt Chart component built with vanilla JavaScript. It uses client-side rendering for fast performance and dynamic interactivity. Perfect for any project requiring an interactive timeline or schedule display.
More Features:
- Multilingual Support: Make your Gantt charts globally accessible with support for multiple languages.
- Tasks and Collapsible Task Groups: Structure your tasks in an organized manner and easily navigate through them.
- Dependencies and Highlighting: Visualize task dependencies and get task details with a simple hover.
- Data Editability: Update your Gantt table on-the-go with an embedded list of responsible parties.
- Additional Columns: Enrich your Gantt table with more data using additional columns.
- Dynamic Loading and Format Change: Load tasks dynamically and switch effortlessly between Hour, Day, Week, Month, and Quarter formats.
- Remote or Local Data: Source your Gantt data from local JS objects or remote JSON/XML data sources.
- Also works with Angular, React, Vue, and .Net
How to use it:
1. Install and import the jsGantt.
# NPM
$ npm i jsgantt-improved
import {JSGantt} from 'jsgantt-improved';2. Or directly load the required JS/CSS files in the document.
<!-- OR -->
<link rel="stylesheet" href="dist/jsgantt.css" />
<script src="dist/jsgantt.js"></script>
3. Create an empty container to hold the Gantt Chart.
<div style="position:relative" class="gantt" id="example"></div>
4. Create a new instance of the Gantt Chart.
- pDiv: Selector of the chart container,
- pFormat: “hour”, “day”, “week”, “month”, or “quarter”
// JSGantt.GanttChart(pDiv, pFormat);
const myChart = new JSGantt.GanttChart(document.getElementById('GanttChartDIV'), 'day');
5. Load task data from JS objects, JS strings, JSON, or XML.
// object
myChart.AddTaskItemObject({
  pID: 1,
  pName: "Name 1",
  pStart: "2023-02-25",
  pEnd: "2023-03-17",
  pPlanStart: "2023-04-01",
  pPlanEnd: "2023-04-15 12:00",
  pClass: "",
  pPlanClass: ""
  pLink: "",
  pMile: 0,
  pRes: "Brian", // resource name
  pComp: 0,
  pGroup: 0, // 0 = normal task, 1 = standard group task, 2 = combined group task
  pParent: 0, // parent ID
  pOpen: 1, // 1 = open, 0 = closed
  pDepend: "", // comma separated list of ids this task is dependent on
  pCaption: "",
  pCost: 1000,
  pNotes: "Some Notes text",
  pBarText: "ex. bar text",
  category: "My Category",
  sector: "Finance"
});
// JSON
JSGantt.parseJSON('./data.json', myChart);// XML
JSGantt.parseXML("./data.xml", myChart);4. Draw the chart on the page.
myChart.Draw();
5. Remove a task item by ID.
myChart.RemoveTaskItem(5);
6. Clear all tasks.
myChart.ClearTasks()
7. Set options.
g.setOptions({
  vCaptionType: 'Complete',  // Set to Show Caption : None,Caption,Resource,Duration,Complete,
  vQuarterColWidth: 36,
  vDateTaskDisplayFormat: 'day dd month yyyy', // Shown in tooltip box
  vDayMajorDateDisplayFormat: 'mon yyyy - Week ww',// Set format to display dates in the "Major" header of the "Day" view
  vWeekMinorDateDisplayFormat: 'dd mon', // Set format to display dates in the "Minor" header of the "Week" view
  vLang: lang,
  vAdditionalHeaders: { // Add data columns to your table
    category: {
      title: 'Category'
    },
    sector: {
      title: 'Sector'
    }
  },
  vShowTaskInfoLink: 1, // Show link in tool tip (0/1)
  vShowEndWeekDate: 0,  // Show/Hide the date for the last day of the week in header for daily view (1/0)
  vUseSingleCell: 10000, // Set the threshold at which we will only use one cell per table row (0 disables).  Helps with rendering performance for large charts.
  vFormatArr: ['Day', 'Week', 'Month', 'Quarter'], // Even with setUseSingleCell using Hour format on such a large chart can cause issues in some browsers
  vScrollTo: new Date(),
  // EVENTS
  // OnChangee
  vEventsChange: {
    taskname: console.log,
    res: console.log,
  },
  // EventsClickCell
  vEvents: {
    taskname: console.log,
    res: console.log,
    dur: console.log,
    comp: console.log,
    start: console.log,
    end: console.log,
    planstart: console.log,
    planend: console.log,
    cost: console.log,
    additional_category: console.log, // for additional fields
    beforeDraw: ()=>console.log('before draw listener'),
    afterDraw: ()=>console.log('before after listener')
  },
  vEventClickRow: console.log,
  vEventClickCollapse: console.log
});
Changelog:
04/13/2026
- v3.0.0
See Also:
 Interactive Gantt Charts in Vanilla JavaScript – VikCraft Gantt
 Draggable & Resizable SVG Gantt Chart – Frappe Gantt
 Generate Interactive SVG/Canvas Gantt Charts With JavaScript
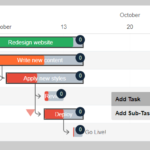 Simple Interactive Gantt Chart Creator
 Easy Gantt Chart Builder In JavaScript – Gantt.js
 Parallel Timelines Chart With JavaScript And SVG
 Visualize Your Workflow In A Gantt Chart
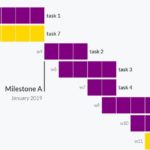 Dynamic Gantt Chart Web Component