


Frappe Gantt is a draggable, resizable, multilingual, modern-looking Gantt Chart library written in JavaScript and SVG.
It provides an interactive data visualization solution for Project Management, Resource Scheduling, Production Planning, Marketing Campaigns, and other time series based application scenarios.
See Also:
- Modern SVG Based Chart Library – Frappé Charts
- Versatile Gantt Chart Component – jsGantt
- 10 Best Gantt Chart Plugins In JavaScript
Installation:
# NPM
$ npm install frappe-gantt
How to use it:
1. Download and import the Frappe Gantt’s files.
<link rel="stylesheet" href="/dist/frappe-gantt.css" />
<script src="/dist/frappe-gantt.umd.js"></script>
2. Create a container for the Gantt Chart.
<div class="gantt-container"></div>
3. Prepare the data representing your tasks.
const tasks = [
      {
        start: '2023-01-01',
        end: '2023-02-01',
        name: 'Redesign CSSScript.com',
        id: "Task 0",
        progress: 20
      },
      {
        start: '2023-01-15',
        end: '2023-03-15',
        name: 'Redesign jQueryScript.net',
        id: "Task 1",
        progress: 5,
        dependencies: 'Task 0'
      },
      {
        start: '2023-03-01',
        end: '2023-04-15',
        name: 'Redesign VueScript.Com',
        id: "Task 2",
        progress: 10,
        dependencies: 'Task 1'
      },
      {
        start: '2023-05-01',
        end: '2023-06-15',
        name: 'Redesign ReactScript.Com',
        id: "Task 3",
        progress: 5,
        dependencies: 'Task 2'
      },
      {
        start: '2023-05-15',
        end: '2023-07-30',
        name: 'Redesign 365webresources.Com',
        id: "Task 4",
        progress: 0,
        dependencies: 'Task 2'
      },
      {
        start: '2023-08-01',
        end: '2023-09-15',
        name: 'Redesign ScriptByAI.Com',
        id: "Task 5",
        progress: 0,
        dependencies: 'Task 4',
        custom_class: 'bar-milestone'
      },
      {
        start: '2023-10-01',
        end: '2023-11-30',
        name: 'Create A New Website',
        id: "Task 6",
        progress: 0
      }
]
4. Initialize the Gantt Chart and specify the target container.
const myChart = new Gantt(".gantt-container", tasks, {
      // options here
});
5. The library provides six views to fit your projects:
- ‘Hour’
- ‘Quarter Day’
- ‘Half Day’
- ‘Day’ (default)
- ‘Week’
- ‘Month’
- ‘Year’
const myChart = new Gantt(".gantt-container", tasks, {
      view_mode: 'Year',
});
6. Change the language.
const myChart = new Gantt(".gantt-container", tasks, {
      // or 'es', 'it', 'ru', 'ptBr', 'fr', 'tr', 'zh', 'de', 'hu'
      language: 'en',
});
7. Popup function.
const myChart = new Gantt(".gantt-container", tasks, { popup: (ctx) => {
ctx.set_title(ctx.task.name);
if (ctx.task.description) ctx.set_subtitle(ctx.task.description);
else ctx.set_subtitle('');
const start_date = date_utils.format(
ctx.task._start,
'MMM D',
ctx.chart.options.language,
);
const end_date = date_utils.format(
date_utils.add(ctx.task._end, -1, 'second'),
'MMM D',
ctx.chart.options.language,
);
ctx.set_details(
`${start_date} - ${end_date} (${ctx.task.actual_duration} days${ctx.task.ignored_duration ? ' + ' + ctx.task.ignored_duration + ' excluded' : ''})<br/>Progress: ${Math.floor(ctx.task.progress * 100) / 100}%`,
);
},
});8. More configuration options.
const myChart = new Gantt(".gantt-container", tasks, {
      header_height: 50,
      column_width: 30,
      step: 24,
      bar_height: 20,
      bar_corner_radius: 3,
      arrow_curve: 5,
      auto_move_label: false,
      container_height: 'auto',
      upper_header_height: 45,
      lower_header_height: 30,
      snap_at: null,
      infinite_padding: true,
      padding: 18,
      date_format: 'YYYY-MM-DD',
      holidays: { 'var(--g-weekend-highlight-color)': 'weekend' },
      ignore: [],
      lines: 'both', // none for no lines, vertical for only vertical lines, horizontal for only horizontal lines, both for complete grid.
      move_dependencies: true,
      popup_on: 'click',
      readonly_progress: false,
      readonly_dates: false,
      readonly: false,
      scroll_to: 'today', // today, start, end, or a date string.
      show_expected_progress: false,
      today_button: true,
      view_mode_select: false,
      view_modes: DEFAULT_VIEW_MODES, // Day, Week, Month, Year
});
9. API methods.
myChart.update_options(options);
myChart.change_view_mode('Week');
myChart.scroll_current();
myChart.update_task(task_id, new_details);
Changelog:
v1.0.3 (02/22/2025)
- A complete rewrite of the framework, with many enhancements, bug fixes, and a fresh UI.
v0.8.0 (09/12/2024)
- Add Italian month names
- feat: add support for german and hungarian languages
- Use Intl.DateTimeFormat to translate month names
- Feat: Add Grid highlight for current week, month, year
- feat: expected progress bars
- feat: add dark mode support
- Minor Fixes
- New Features
- Rewrite Framework
- Tooling and Bug Fixes
- fix: use css to align lower text dates
See Also:
 Versatile Gantt Chart Component – jsGantt
 Interactive Gantt Charts in Vanilla JavaScript – VikCraft Gantt
 Generate Interactive SVG/Canvas Gantt Charts With JavaScript
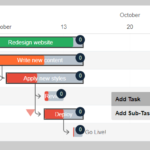 Simple Interactive Gantt Chart Creator
 Easy Gantt Chart Builder In JavaScript – Gantt.js
 Parallel Timelines Chart With JavaScript And SVG
 Visualize Your Workflow In A Gantt Chart
 Dynamic Gantt Chart Web Component