


An easy-to-use yet robust JavaScript library for generating interactive Gantt charts using SVG, Canvas and JSX.
Can be used to represent project schedules, dependencies, and progress in a graphical manner.
See Also:
How to use it:
1. Install and import the gantt chart component.
import {
  SVGGantt, // SVG Chart
  CanvasGantt, // Canvas Chart
  StrGantt // SVG Strings
} from 'gantt';
2. Create an empty container to hold the Gantt Chart.
<!-- SVG Chart -->
<div id="svg-example"></div>
<!-- Canvas Chart -->
<canvas id="canvas-example"></canvas>
3. Prepare your data as follows:
const data = [{
  /* id: number,
  parent: number,
  text: string,
  start: Date,
  end: Date,
  percent: number,
  links: Array<Link>
  */
  id: 1,
  type: 'group',
  text: '1 Waterfall model',
  start: new Date('2018-10-10T09:24:24.319Z'),
  end: new Date('2018-12-12T09:32:51.245Z'),
  percent: 0.71,
  links: []
}, {
  id: 11,
  parent: 1,
  text: '1.1 Requirements',
  start: new Date('2018-10-21T09:24:24.319Z'),
  end: new Date('2018-11-22T01:01:08.938Z'),
  percent: 0.29,
  links: [{
    target: 12,
    type: 'FS' // 'FS' | 'FF' | 'SS' | 'SF'
  }]
}, {
  id: 12,
  parent: 1,
  text: '1.2 Design',
  start: new Date('2018-11-05T09:24:24.319Z'),
  end: new Date('2018-12-12T09:32:51.245Z'),
  percent: 0.78,
}];
4. Render your data in the Gantt Charts.
// SVG Chart
new SVGGantt('#svg-example', data, {
    // options
});
// Canvas Chart
new CanvasGantt('#canvas-root', data, {
    // options
});
// SVG Strings
const strGantt = new StrGantt(data, {
      // options
});
this.body = strGantt.render();
5. Available options to customize the Gantt Charts.
{
  viewMode: 'day', // 'day' | 'week' | 'month',
  onClick: (item: Item) => {},
  offsetY: : 60,
  rowHeight: 40,
  barHeight: 16,
  thickWidth: 1.4,
  styleOptions: {
    bgColor:'#fff'
    lineColor: '#eee'
    redLineColor: '#f04134'
    groupBack: '#3db9d3'
    groupFront: '#299cb4'
    taskBack: '#65c16f'
    taskFront: '#46ad51'
    milestone: '#d33daf'
    warning: '#faad14'
    danger: '#f5222d'
    link: '#ffa011'
    textColor: '#222'
    lightTextColor: '#999'
    lineWidth: '1px'
    thickLineWidth: '1.4px'
    fontSize: '14px'
    smallFontSize: '12px'
    fontFamily: '-apple-system, BlinkMacSystemFont, "Segoe UI", Roboto, "Helvetica Neue", Arial, sans-serif'
  }
}
See Also:
 Versatile Gantt Chart Component – jsGantt
 Interactive Gantt Charts in Vanilla JavaScript – VikCraft Gantt
 Draggable & Resizable SVG Gantt Chart – Frappe Gantt
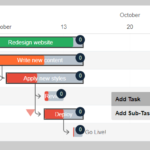 Simple Interactive Gantt Chart Creator
 Easy Gantt Chart Builder In JavaScript – Gantt.js
 Parallel Timelines Chart With JavaScript And SVG
 Visualize Your Workflow In A Gantt Chart
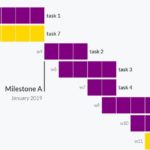 Dynamic Gantt Chart Web Component