


Ever wanted a Gantt Chart to display your tasks scheduled over time?
Gantt.js is a tiny JavaScript library that makes it easier to render a simple, plain, responsive Gantt Chart from any scheduled tasks defined in a JS array. Enjoy it.
How to use it:
1. Start by loading the following JavaScript and CSS files in the document.
<link rel="stylesheet" href="./gantt.css" />
<script src="./gantt.js"></script>
2. Create an empty element that serves as the container for the Gantt Chart.
<div id="chart"></div>
3. Define your scheduled tasks in a JS object.
let data =  [
    {
      recordID: 1,
      row: "Row for ID #1",
      tooltip: "Tooltips here! Get your tooltips!",
      start: "Wed Jun 03 2020 14:21:55",
      end: "Wed Jun 03 2020 20:21:55",
      urls: "https://www.cssscript.com"
    },
    {
      recordID: 2,
      row: "Row for ID #2",
      tooltip: "Tooltip for row 2",
      start: "Jun 03 2020 11:00:00",
      end: "Jun 03 2020 15:23:43",
      urls: "https://www.cssscript.com"
    },
    {
      recordID: 1,
      row: "Row for ID #1",
      tooltip: "Tooltip unique to this item",
      start: "Wed Jun 03 2020 06:00:00",
      end: "Wed Jun 03 2020 10:00:00",
      urls: "https://www.cssscript.com"
    }
];
4. Pass parameters to the Gantt chart.
let params = {
    sidebarHeader: "Unused right now",
    noDataFoundMessage: "No data found",
    startTimeAlias: "start",
    endTimeAlias: "end",
    idAlias: "recordID",
    rowAlias: "row",
    linkAlias: "urls",
    tooltipAlias: "tooltip",
    groupBy: [],
    groupByAlias: [],
    refreshFunction: refreshFunction
}
5. Grab data from the JS object.
function refreshFunction() {
  return data;
}
6. Generate the Gantt chart.
let ganttChart = new Gantt("chart", params);7. Refresh the Gantt chart if needed.
ganttChart.refreshData();
Changelog:
11/19/2020
- Added config parameter groupByAlias
See Also:
 Versatile Gantt Chart Component – jsGantt
 Interactive Gantt Charts in Vanilla JavaScript – VikCraft Gantt
 Draggable & Resizable SVG Gantt Chart – Frappe Gantt
 Generate Interactive SVG/Canvas Gantt Charts With JavaScript
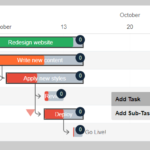 Simple Interactive Gantt Chart Creator
 Parallel Timelines Chart With JavaScript And SVG
 Visualize Your Workflow In A Gantt Chart
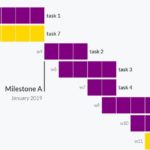 Dynamic Gantt Chart Web Component
Super script! it’s a pity that only during one day: /