| Author: | mshamory |
|---|---|
| Views Total: | 1,757 views |
| Official Page: | Go to website |
| Last Update: | December 7, 2015 |
| License: | MIT |
Preview:

Description:
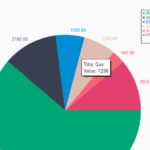
PieChartLib.js is a lightweight JavaScript library used to generate flat 2D pie chart using HTML5 canvas element.
How to use it:
Include the PieChartLib.js JavaScript file on the webpage.
<script src="PieChartLib.js"></script>
Create an HTML5 canvas element on where you want to draw the pie chart.
<canvas id="demo"></canvas>
Create new pie chart.
var canvas = document.getElementById('canvas');
var graph = new PieChart(canvas, radius, x, y);
Add items to the pie chart.
graph.items.push(new PieChartDataItem(70, "rgb(255, 0, 0)"));
graph.items.push(new PieChartDataItem(30, "rgb(0, 255, 0)"));
Draw a pie chart on the canvas element.
graph.draw();
Settings available.
background = "rgba(255,255,255,1)";
border = {size: 10, color: "rgba(255,255,255,1)"};
shadow = {offsetX: 0, offsetY: 0, blur: 10, color: "rgba(0,0,0,.3)"};
offsetAngle = 0;


