


SVG Gauge is a dependency-free JavaScript library for drawing customizable, animated gauges using JavaScript and SVG.
How to use it:
Load the minified version of the SVG Gauge library in the html file.
<script src="dist/gauge.min.js"></script>
Create a container to hold the gauge.
<div id="gauge-demo" class="gauge-container"></div>
The JavaScript to render a basic gauge in the container you created.
var myGauge = Gauge(document.getElementById("gauge-demo"));The example CSS to customize the gauge, dial, value, text, etc.
.gauge-container > .gauge > .dial {
  stroke: #334455;
  stroke-width: 2;
}
.gauge-container > .gauge > .value {
  stroke: rgb(47, 227, 255);
  stroke-width: 2;
}
.gauge-container > .gauge > .value-text {
  fill: rgb(47, 227, 255);
  font-family: sans, 'sans-serif';
  font-weight: bold;
  font-size: 0.6em;
}
Default configuration options.
var myGauge = Gauge(document.getElementById("gauge-demo"),{
    dialRadius: 40,
    dialStartAngle: 135,
    dialEndAngle: 45,
    value: 0,
    max: 100,
    min: 0,
    valueDialClass: "value",
    valueClass: "value-text",
    dialClass: "dial",
    gaugeClass: "gauge",
    showValue: true,
    gaugeColor: null,
    label: function(val) {return Math.round(val);} // returns a string label that will be rendered in the center
});
See Also:
 Responsive CSS Chart Library For Web – Neo Charts
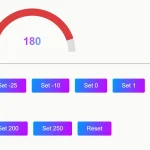 Minimal JavaScript Gauge Library: No SVG/Canvas
 Customizable Gauge Library With JavaScript And Canvas – Gauge.js
 Create Minimal Dial Gauges With JavaScript And SVG
 Canvas-based JavaScript Knob/Dial Component – pure-knob
 Minimal Gauge Meter In Pure CSS
 Canvas Based HTML5 Gauge Library – Gauge.js
 Two-dimensional Gauge Component With JS And SVG – DoubleGauge
Thank you!