Customizable SVG-based Radar Chart Library – maturity-radar

maturity-radar is an easy, CSS-less JavaScript library used to render a dynamic, customizable, SVG based radar chart in the document.


maturity-radar is an easy, CSS-less JavaScript library used to render a dynamic, customizable, SVG based radar chart in the document.

jschart is a small JavaScript data visualization library for drawing a simple line chart on an HTML5 canvas element.
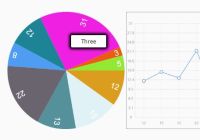
g-chart is a pure Vanilla JavaScript library used to render dynamic HTML5 charts using on the canvas elements. Currently, it supports pie and line charts.
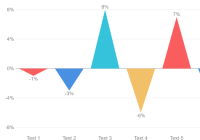
moChart is a handy yet highly customizable chart library that lets you render line chart, bar chart, circle chart and triangle chart on HTML5 canvas element.
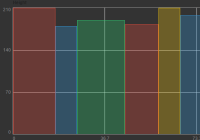
Bar.js is a simple, tiny JS library used for dynamically rendering horizontal and/or vertical bar / column charts from plain JS data.
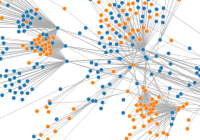
ggraph is an interaction graph visualization library which allows you to merge, split and remove messy data using the familiar D3.js library.
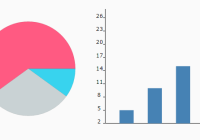
krap.js is a lightweight and dependency-free JS library used for drawing simple dynamic charts on the html page using SVG.
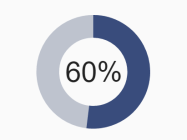
A tiny JavaScript library which takes advantage of the Raphael.js library to draw animated, configurable, SVG-based, circular ring chart / progress indicator on the webpage.
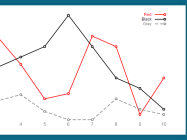
chartress.js is a lightweight JavaScript library which uses SVG.js to draw line / column / pie charts on the html page.
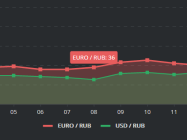
Easygraphs.js is an easy, flexible and high-performance JavaScript graph library used to plot your data as animated, SVG based charts, lines, dots and areas.