


krap.js is a lightweight and dependency-free JS library used for drawing simple dynamic charts on the html page using SVG. Currently supports pie and bar(column) charts.
Preview:
Import the krap.js and krap.css into the html page.
<script src="krap.js"></script>
<link rel="stylesheet" href="krap.css">
Create a placeholder element for the chart.
<div id="container" >
</div>
Define an array of objects you want to present in the chart.
var json =[
    {oracle:[
      {profits:[
              {phones:1},
              {software:2}
      ]},
      {loss:[3]},
      {misc:[6]},
    ]},
    {amazon:[10]},
    {google:[60]},
    {microsoft:[20]}
];
Render the data as a pie chart inside the DIV container you created.
properties = {}
properties['width'] = 300;
properties['height']=300;
properties['data']= [10,30,60]
properties['colours']= ['#38D3EE', '#C9D2D4', '#FF5A82'];
chart.pie('pie',properties);
Render a pie chart inside the DIV container you created.
var  props = {
    'width': 300,
    'height': 300,
    'data': {'apple':5,'oracle':10,'google':15,'tesla':20,'A':15,'B':10,'C':5},
    'xCords': [],
    'yCords': [],
    'yCordsSorted': [],
    'divId': 'undefined',
    'datumsPerScreen': 4,
    'colours': {},
    'barColours': 'blue',
    'yTickLabels': {},
    'svgObj': 'undefined',
    'axisType': 'generateSimpleAxis'
};
chart.bar('bar',props);
See Also:
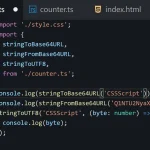 Base64 URL Encoder and Decoder with UTF-8 support – base64url
 Material Design Ripple Click Effect With Pure CSS
 In-Page Logging for Web Devs – PrettyLogger.js
 Check Card Interactions In Pure CSS
 JavaScript Library For Lazy Loading And Multi-serving Of images
 Android Style Toggle Switch In CSS – togglebtn.css
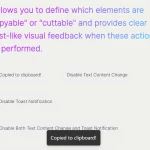 Advanced Clipboard (Copy/Paste/Cut) Management Library – ClipX.js
 Light and Clean Tooltips With CSS3 Animations – html5tooltips.js