Lightweight Financial Chart JavaScript Library – lightweight-charts v5

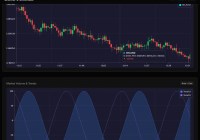
Create stock and crypto price charts with Lightweight Charts v5, including candlesticks, volume, realtime data, markers and chart configuration.


Create stock and crypto price charts with Lightweight Charts v5, including candlesticks, volume, realtime data, markers and chart configuration.

Microsoft’s MorphCharts JavaScript library creates 3D data visualizations with WebGPU, ray tracing, and Vega-inspired JSON specs for immersive data experiences.

A customizable, flexible, multilingual Gantt Chart component built with vanilla JavaScript.

Create lightweight pie/donut charts with CSS conic gradient. No canvas, no SVG, no dependencies.

Create bar, line, and pie charts with pure JavaScript. Beaned-Charts delivers responsive SVG visualizations with no framework requirements.
Build smooth, GPU-accelerated charts with ChartGPU. This library handles millions of data points and real-time updates. Native TypeScript support.

Render Mermaid diagrams as beautiful SVGs or ASCII art. Fast, themeable, zero DOM dependencies. Built for AI assistants and CLI tools.

Build inline line, bar, tristate, discrete, bullet, pie, and box charts with Sparklines.js. Vanilla JavaScript sparkline library with flexible data input and customization.

A JavaScript and HTML5 Canvas based graph & chart JavaScript library for creating line charts with grid lines on your web app.

Visualize CSS animations as interactive graphs. Monorail.js extracts keyframes, shows easing curves, and lets you scrub through animation timelines.