


TreeSpider is a robust JavaScript library that helps you generate responsive, interactive organization charts, family trees, or any tree-like structure.
Features:
- Interactive Charts: Create zoomable and rotatable tree charts.
- CSS Customizable: Fully style the appearance to match your branding.
- Multiple Chart Types: Supports various chart types, e.g., default, cellar, goldenRod, hSpider, hSpiderWalk, radialSpiderLeg, vSpiderWalk.
- Data-Driven: Uses a simple, linear data structure (ID and parentID).
- No Dependencies: Lightweight and easy to integrate.
- API Control: Programmatically control zoom, rotation, and appearance.
- Event Handling: Listen for events like initialization, expansion, collapse, and zooming.
- Large Data Handling: Display a large amount of data in steps.
- D3.js Powered: Built using the D3.js library for robust visualization.
- TypeScript Based: Developed with TypeScript.
How to use it:
1. Install & download.
# NPM
$ npm install treespider
2. Import TreeSpider into your project.
// ES Module
import TreeSpider from 'treespider';
// Browser
<link rel="stylesheet" href="treeSpider.css" />
<script src="treeSpider.bundle.min.js"></script>
3. Create a container element where the tree chart will appear:
<div id="example"></div>
4. Prepare your data as an array of objects. Each object must include a unique id, a parentId for subordinates (except the overall head), and additional fields. For example:
const myData = [
  {id: "A1", name: "John Smith", role: "CEO", location: "New York, USA"},
  {id: "A2", parentId: "A1", name: "Alice Johnson", role: "VP of Marketing", location: "London, UK", image: "/path/to/image/"},
  {id: "A3", parentId: "A1", name: "Bob Williams", role: "VP of Engineering", location: "San Francisco, USA"},
  // ...
];
5. Initialize TreeSpider with your container and data:
const instance = new TreeSpider({
  targetContainer: '#example',
  tree_data: myData,
});
6. All available options to customize the tree chart.
| Option | Type | Default | Required | Description | |||
|---|---|---|---|---|---|---|---|
targetContainer | string | none | Yes | The CSS selector of the HTML element where treeSpider will be created. Use body for the entire page. | |||
placeEl | `’override’ \ | ‘start’ \ | ‘end’ \ | { beforeEl: string; }` | 'override' | No | How to place the treeSpider container within the targetContainer. Use { beforeEl: 'selector' } to insert before a specific element. |
width | string | '900px' | No | Width of the treeSpider container. | |||
height | string | '500px' | No | Height of the treeSpider container. | |||
autoInitialize | boolean | true | No | Set to false to manually initialize treeSpider using the initialize() method. | |||
tree_data | Array<IChartHead> | undefined | No | Array of data representing the hierarchical structure. See the “Data Structure” section for details. | |||
color_range | string[] | ['#b31212', '#b34712', '#b38d12', '#9ab312', '#2fb312', '#12b362', '#12b3a8', '#1278b3', '#1712b3', '#5712b3', '#8d12b3', '#b3128d', '#b3124a', '#b31212'] | No | Array of colors (hex or names) used for chart heads. treeSpider interpolates these colors. | |||
tree_type | string | default | No | Type of chart. Options: default, cellar, goldenRod, hSpider, hSpiderWalk, radialSpiderLeg, vSpiderWalk. | |||
chart_head_type | string | default | No | Chart head style. Options: default, landscape, rounded. | |||
show_tools | boolean | true | No | Set to false to hide the UI tools panel. | |||
show_chart_head_border | boolean | true | No | Set to false to hide borders around chart heads. | |||
animation_rotation_speed | number | 10 | No | Rotation speed in milliseconds (lower value = faster, smoother rotation). | |||
animation_rotation_interval | number | 1 | No | Rotation increment in degrees (lower value = smoother rotation). | |||
backgroundPattern | string | default | No | Background pattern. Options: none, default, flux, quad, blurry, chaos, flurry, spiral, whirling, replicate, scribble, squiggly, gyrrate, leaves, spot. | |||
backgroundPosition | string | undefined | No | CSS background-position for the SVG background. | |||
backgroundSize | string | undefined | No | CSS background-size for the SVG background pattern. | |||
customBackground | string | undefined | No | Stringified SVG element for a custom background pattern. | |||
head_linker_thumb_circle_radius | number | 8 | No | Radius of the linker thumb shape (the expand/collapse control). | |||
linker_thumb_icon_color | string | bright500 | No | Color of the icon within the linker thumb. Options: brighter, bright500, bright100. | |||
linker_thumb_shape | string | symbolCircle | No | D3 shape of the linker thumb. Options: symbolAsterisk, symbolCircle, symbolCross, symbolDiamond, symbolDiamond2, symbolPlus, symbolSquare, symbolSquare2, symbolStar, symbolTriangle, symbolTriangle2, symbolWye, symbolX. | |||
head_image_shape | string | symbolCircle | No | D3 shape of the chart head image/initials container. Options: symbolCircle, symbolCross, symbolDiamond, symbolDiamond2, symbolSquare, symbolSquare2, symbolStar, symbolTriangle, symbolTriangle2, symbolWye. | |||
chart_head_bg | string | #ffffff | No | Background color of chart heads. | |||
auto_set_chart_head_bg | boolean | false | No | If true, uses the webpage’s body background color for chart heads. | |||
display_tree_in_step | boolean | false | No | If true, renders the tree in steps (useful for large datasets). | |||
auto_display_tree_in_step | boolean | true | No | Automatically displays the tree in steps if the data length exceeds 500. | |||
tree_level_step | number | 2 | No | Number of levels to display per step when display_tree_in_step is true. | |||
dropshadow | object | { x: "-50%", y: "-50%", width: "200%", height: "200%", dx: 1, dy: 1, stdDeviation: 4, floodColor: "rgba(91, 91, 91, 0.19)", } | No | Options to configure the SVG feDropShadow filter for chart heads (not applicable to rounded chart head type). See the breakdown below the main table. | |||
pallet | object | { h: 10, s: 0.5, l: 0.5, darker: 3, brighter: 0.8, bright100: 0.5, dark100: 0.5, gray: 50, gray85: 85 } | No | Options for tuning color variants within chart heads. See the breakdown below the main table. | |||
tree_link_type | string | undefined | No | D3 link curve type. Options: curveBumpX, curveBumpY, curveBasisClosed, curveLinear, curveStep, curveStepAfter, curveStepBefore. | |||
random_data_length | number | 200 | No | Length of randomly generated data (if used). | |||
zoom_in_distance | number | 1.5 | No | Zoom-in extent when using the zoom-in button. | |||
zoom_out_distance | number | 0.5 | No | Zoom-out extent when using the zoom-out button. | |||
verticalSpace | string | '120px' | No | Vertical space between parent and child chart heads. | |||
font_link | string | https://fonts.googleapis.com/css2?family=Lato:ital,wght@0,100;0,300;0,400;0,700;0,900;1,100;1,300;1,400;1,700;1,900&display=swap | No | Google Fonts link (or local font path) | |||
font_name | string | Lato | No | Name of the font provided in font_link. |
dropshadow Option Details:
| Property | Type | Description |
|---|---|---|
x | string | X position of the drop shadow. |
y | string | Y position of the drop shadow. |
width | string | Width of the drop shadow effect area. |
height | string | Height of the drop shadow effect area. |
dx | number | X offset of the drop shadow. |
dy | number | Y offset of the drop shadow. |
stdDeviation | number | Standard deviation for the blur effect. |
floodColor | string | Color of the drop shadow. |
pallet Option Details:
| Property | Type | Description |
|---|---|---|
h | number | Hue (HSL color). |
s | number | Saturation (HSL color). |
l | number | Lightness (HSL color). Adjusts brightness of color variants. |
darker | number | How much darker the darker color variants should be. |
brighter | number | How much brighter the brighter color variants should be (direct variant). |
bright100 | number | Brighter variant of the HSL-tuned color. |
dark100 | number | Darker variant of the HSL-tuned color. |
gray | number | Gray level (0-100, 0 = darkest, 100 = lightest) generated with d3.gray. |
gray85 | number | Gray level, 85% by default. |
const instance = new TreeSpider({
  targetContainer: '',
  width: '100%',
  height: '500px',
  placeEl: 'override',
  tree_data: undefined,
  color_range: [],
  /* default
  cellar
  goldenRod
  hSpider
  hSpiderWalk
  radialSpiderLeg
  vSpiderWalk */
  tree_type: 'default',
  chart_head_type: 'default', // 'default', 'landscape', 'rounded'
  show_tools: true,
  show_chart_head_border: false,
  animation_rotation_speed: 10,
  animation_rotation_interval: 1,
  backgroundPattern: 'default',
  backgroundSize: undefined,
  customBackground: undefined,
  backgroundPosition: undefined,
  head_linker_thumb_circle_radius: 8,
  linker_thumb_icon_color: 'bright500',
  /* symbolAsterisk
  symbolCircle
  symbolCross
  symbolDiamond
  symbolDiamond2
  symbolPlus
  symbolSquare
  symbolSquare2
  symbolStar
  symbolTriangle
  symbolTriangle2
  symbolWye
  symbolX */
  linker_thumb_shape: 'symbolCircle',
  /* symbolCircle
  symbolCross
  symbolDiamond
  symbolDiamond2
  symbolSquare
  symbolSquare2
  symbolStar
  symbolTriangle
  symbolTriangle2
  symbolWye */
  head_image_shape: 'symbolCircle',
  chart_head_bg: '#ffffff',
  auto_set_chart_head_bg: false,
  display_tree_in_step: false,
  auto_display_tree_in_step: true,
  tree_level_step: 2,
  pallet: {
    h: 10,
    s: 0.5,
    l: 0.5,
    darker: 3,
    brighter: 0.8,
    bright100: 0.5,
    dark100: 0.5,
    gray: 50,
    gray85: 85
  },
  tree_link_type: undefined,
  random_data_length: 200,
  // random_data_locale: window.navigator.language, // Suspended - the user's device's locale
  autoInitialize: true,
  zoom_in_distance: 1.5,
  zoom_out_distance: 0.5,
  verticalSpace: '120px',
  font_link: "https://fonts.googleapis.com/css2?family=Lato:ital,wght@0,100;0,300;0,400;0,700;0,900;1,100;1,300;1,400;1,700;1,900&display=swap",
  font_name: "Lato",
  dropshadow: {
    x: "-50%",
    y: "-50%",
    width: "200%",
    height: "200%",
    dx: 1,
    dy: 1,
    stdDeviation: 4,
    floodColor: "rgba(91, 91, 91, 0.19)",
  }
})
7. API methods.
| Method | Parameters | Description | |
|---|---|---|---|
initialize() | none | Manually initializes treeSpider (required if autoInitialize is false). | |
resetZoom() | none | Resets zoom level and centers the chart to the default view. | |
updateChartHeadBg(color: string) | color: string | Sets the background color of all chart heads. Accepts hex codes, color names, or other CSS color formats. | |
on(eventName, callbackFn) | eventName: TEventTypecallbackFn: (data?: any) => null | Adds an event listener. See the “Events” table for available event types. | |
setOptions(options) | options_to_set: Omit<ITreeSpiderMain,'targetContainer'> | Sets or overrides library options. Best used before initialization, especially when autoInitialize is false. | |
zoom(direction) | `dir: ‘in’ \ | ‘out’` | Programmatically zooms the chart in or out. |
startStopRotateCW() | none | Starts or stops clockwise rotation (only applicable to radial/circular tree types). | |
startStopRotateACW() | none | Starts or stops anticlockwise rotation (only applicable to radial/circular tree types). | |
rotateOnceCW() | none | Rotates the tree once clockwise (only applicable to radial/circular tree types). | |
rotateOnceACW() | none | Rotates the tree once anticlockwise (only applicable to radial/circular tree types). |
8. Event handlers.
| Event Name | Data | Description |
|---|---|---|
library.init | { rootContainer: HTMLElement } | Emitted once after treeSpider is initialized. |
chart_head.create | { headNode: SVG } | Emitted after a chart head is created, but before it’s added to the UI. Provides the SVG element. |
chart_head.expanded | { svgNode: SVG, head_data: Object, pointPosition: number } | Emitted when a chart head is expanded. Provides the SVG node, data, and point position. |
chart_head.collapsed | { svgNode: SVG, head_data: Object, pointPosition: number } | Emitted when a chart head is collapsed. Provides the SVG node, data, and point position. |
zooming | { e: ZoomBehavior } | Emitted during zooming and panning interactions (including automatic zooming/panning). Provides D3 zoom data. |
See Also:
 Easy Family Tree & Organization Chart Generator – treeData.js
 Pretty Clean Tree Diagram In Pure CSS
 Render Family/Organization Tree From JSON – treeMaker
 CSS Only Responsive Organization/Family Tree
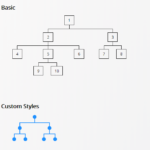 Semantic Hierarchy Tree In Pure CSS – Treeflex
 Multi-Select Box With Tree Structured Data Dropdown List – Treeselect
 Dynamic Interactive Tree View With Checkboxes – Treejs
 Render JSON Data As A Tree View – json-view