


SimpleGauge is a lightweight JavaScript library that creates minimal, clean, smooth gauges using only HTML, JavaScript, and CSS. You don’t need SVG or Canvas, which keeps things light and fast.
This library provides a simple way to represent numeric data visually. You can use it to display progress bars, visualize sensorgau data, or create interactive dashboards. For example, a fitness application could show daily activity levels using gauge charts to present exercise progress. A financial dashboard might use a gauge chart to visualize budget spending against a predefined limit.
How to use it:
1. Add the SimpleGauge JavaScript and CSS files to your HTML page.
<link href="gauge.css" rel="stylesheet">
<script src="gauge.js"></script>
2. create a <div> element in your HTML where you want the gauge to appear. Set the minimum, maximum, and initial values using HTML data attributes. The id attribute will be used to reference this specific gauge.
<div id="gauge" data-min="0" data-max="100" data-initial="32"></div>
3. Use the gauge.init() function to initialize the gauge and pass the CSS selector of your gauge container.
document.addEventListener('DOMContentLoaded', () => {
  gauge.init('#gauge');
});
4. Update the value of the gauge.
gauge.set('#gauge', 75);5. Reset the gauge to its initial value.
gauge.reset('#gauge')Changelog:
05/30/2026
- Bugfixes
See Also:
 Responsive CSS Chart Library For Web – Neo Charts
 Customizable Gauge Library With JavaScript And Canvas – Gauge.js
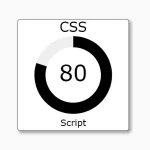 Create Minimal Dial Gauges With JavaScript And SVG
 Canvas-based JavaScript Knob/Dial Component – pure-knob
 Minimal Gauge Meter In Pure CSS
 Canvas Based HTML5 Gauge Library – Gauge.js
 Create Animated Gauges With JavaScript – SVG Gauge
 Two-dimensional Gauge Component With JS And SVG – DoubleGauge