ApexCharts.js: Responsive, Interactive SVG Chart Library for Dashboards and Apps

Create interactive SVG charts in vanilla JavaScript with ApexCharts.js. Customize axes, colors, tooltips, annotations, and exports.


Create interactive SVG charts in vanilla JavaScript with ApexCharts.js. Customize axes, colors, tooltips, annotations, and exports.

Create Read More and Read Less links for articles and product descriptions with adjustable heights and simple JavaScript.

Keep unfinished form entries recoverable with form-saver, including checkboxes, select fields, and optional retention after submission.

A JavaScript library that enables touch-friendly rotate, resize, and drag’n’drop functionalities on HTML elements and/or SVG objects.

An open-source SVG library for brand logos, cloud architecture symbols, and interface icons.

The media-chrome provides a set of web components to create custom media controls for Videos, Audios, and Live Streams.

Transform textareas into powerful Markdown editors. Features include real-time preview, syntax highlighting, and customizable toolbars.
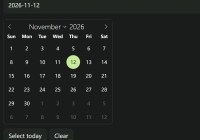
Use flatpickr-ce for date, time, and range inputs, with year-only selection, localization, and the original flatpickr API.

Convert HEX, RGB, HSL, and OKLCH colors in JavaScript with chainable transforms, palette generation, and TypeScript support.

Billboard.js is a simple, reusable, customizable, modular, flexible JavaScript chart library based on the famous D3.js library.