


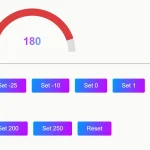
Gauge.js is a pure JavaScript library used to generate animated, dynamic, highly configurable linear/radial gauges using HTML5 canvas element.
Installation:
# NPM
$ npm install canvas-gauges --save
Basic usage:
Load the minified version of Gauge.js library in the webpage.
<script src="gauge.min.js"></script>
Create an HTML5 canvas element on which you want to draw the gauges.
<canvas id="demo"></canvas>
Render a basic linear gauge on the canvas element.
var gauge = new LinearGauge({
    renderTo: '#demo',
    // more settings here
})
Render a basic radial gauge on the canvas element.
var gauge = new LinearGauge({
    renderTo: '#demo',
    // more settings here
})
All the default settings. Note that the settings as shown below can be passed via data-OPTION attributes on the canvas element.
// basic options
renderTo: null,
width: 0,
height: 0,
minValue: 0,
maxValue: 100,
value: 0,
units: false,
majorTicks: [0, 20, 40, 60, 80, 100],
minorTicks: 10,
strokeTicks: true,
animatedValue: false,
animateOnInit: false,
title: false,
borders: true,
// number formats
valueInt: 3,
valueDec: 2,
majorTicksInt: 1,
majorTicksDec: 0,
// animations
animation: true,
animationDuration: 500,
animationRule: 'cycle',
// colors
colorPlate: '#fff',
colorPlateEnd: '',
colorMajorTicks: '#444',
colorMinorTicks: '#666',
colorTitle: '#888',
colorUnits: '#888',
colorNumbers: '#444',
colorNeedle: 'rgba(240,128,128,1)',
colorNeedleEnd: 'rgba(255,160,122,.9)',
colorValueText: '#444',
colorValueTextShadow: 'rgba(0,0,0,0.3)',
colorBorderShadow: 'rgba(0,0,0,0.5)',
colorBorderOuter: '#ddd',
colorBorderOuterEnd: '#aaa',
colorBorderMiddle: '#eee',
colorBorderMiddleEnd: '#f0f0f0',
colorBorderInner: '#fafafa',
colorBorderInnerEnd: '#ccc',
colorValueBoxRect: '#888',
colorValueBoxRectEnd: '#666',
colorValueBoxBackground: '#babab2',
colorValueBoxShadow: 'rgba(0,0,0,1)',
colorNeedleShadowUp: 'rgba(2,255,255,0.2)',
colorNeedleShadowDown: 'rgba(188,143,143,0.45)',
fontNumbers: 'Arial',
fontTitle: 'Arial',
fontUnits: 'Arial',
fontValue: 'Arial',
fontNumbersSize: 20,
fontTitleSize: 24,
fontUnitsSize: 22,
fontValueSize: 40,
fontNumbersStyle: 'normal',
fontTitleStyle: 'normal',
fontUnitsStyle: 'normal',
fontValueStyle: 'normal',
fontNumbersWeight: 'normal',
fontTitleWeight: 'normal',
fontUnitsWeight: 'normal',
fontValueWeight: 'normal',
// needle
needle: true,
needleShadow: true,
needleType: 'arrow',
needleStart: 5,
needleEnd: 85,
needleWidth: 4,
// borders
borderOuterWidth: 3,
borderMiddleWidth: 3,
borderInnerWidth: 3,
borderShadowWidth: 3,
// value and highlights
valueBox: true,
valueBoxStroke: 5,
valueText: '',
valueTextShadow: true,
valueBoxBorderRadius: 2.5,
highlights: [
  { from: 20, to: 60, color: '#eee' },
  { from: 60, to: 80, color: '#ccc' },
  { from: 80, to: 100, color: '#999' }
]
<canvas data-type="radial-gauge"
data-min-value="0"
data-max-value="360"
data-major-ticks="N,NE,E,SE,S,SW,W,NW,N"
data-minor-ticks="22"
data-ticks-angle="360"
data-start-angle="180"
data-stroke-ticks="false"
data-highlights="false"
data-color-plate="#222"
data-color-major-ticks="#f5f5f5"
data-color-minor-ticks="#ddd"
data-color-numbers="#ccc"
data-color-needle="rgba(240, 128, 128, 1)"
data-color-needle-end="rgba(255, 160, 122, .9)"
data-value-box="false"
data-value-text-shadow="false"
data-color-circle-inner="#fff"
data-color-needle-circle-outer="#ccc"
data-needle-circle-size="15"
data-needle-circle-outer="false"
data-needle-type="line"
data-needle-start="75"
data-needle-end="99"
data-needle-width="3"
data-borders="true"
data-border-inner-width="0"
data-border-middle-width="0"
data-border-outer-width="10"
data-color-border-outer="#ccc"
data-color-border-outer-end="#ccc"
data-color-needle-shadow-down="#222"
data-animation-target="plate"
data-animation-duration="1500"
data-animation-rule="linear"
data-width="500"
data-height="500"
data-units="ᵍ"
data-value="0"
></canvas>Changelog:
04/10/2020
- v2.1.7
04/09/2020
- v2.1.6
09/13/2018
- v2.1.5: Bugfix
See Also:
 Minimal JavaScript Gauge Library: No SVG/Canvas
 Responsive CSS Chart Library For Web – Neo Charts
 Customizable Gauge Library With JavaScript And Canvas – Gauge.js
 Create Minimal Dial Gauges With JavaScript And SVG
 Canvas-based JavaScript Knob/Dial Component – pure-knob
 Minimal Gauge Meter In Pure CSS
 Create Animated Gauges With JavaScript – SVG Gauge
 Two-dimensional Gauge Component With JS And SVG – DoubleGauge