| Author: | bradleytaunt |
|---|---|
| Views Total: | 1,524 views |
| Official Page: | Go to website |
| Last Update: | June 29, 2020 |
| License: | MIT |
Preview:

Description:
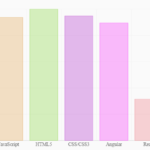
A customizable CSS charting library that converts an HTML table into a column or horizontal bar chart using CSS flexbox.
It falls back to displaying the regular HTML table when users are browsing your webpage on mobile.
How to use it:
1. To get started, insert the core stylesheet flexbox-bar-graph.css into the HTML document.
<link rel="stylesheet" href="flexbox-bar-graph.css" />
2. Add the data-id="flexbox-bar-graph" attribute to your HTML table and define the data using the --data-set CSS variable. The table header is used to generate a legend representing the charted data as follows:
<table data-id="flexbox-bar-graph">
  <caption>Column Chart Example</caption>
  <thead>
    <tr>
      <th>Test Performed</th>
      <th>Before</th>
      <th>After</th>
      <th>Difference</th>
    </tr>
  </thead>
  <tbody>
    <tr>
      <th>Initial Load Time</th>
      <td>
        <span style="--data-set:4.7/5;"></span>
        <p>4.7</p>
      </td>
      <td>
        <span style="--data-set:2.7/5;"></span>
        <p>2.7</p>
      </td>
      <td>
        <span style="--data-set:2/5;"></span>
        <p>2</p>
      </td>
    </tr>
    <tr>
      <th>Visually Complete</th>
      <td>
        <span style="--data-set:3.8/5;"></span>
        <p>3.8</p>
      </td>
      <td>
        <span style="--data-set:1.9/5;"></span>
        <p>1.9</p>
      </td>
      <td>
        <span style="--data-set:1.9/5;"></span>
        <p>1.9</p>
      </td>
    </tr>
    <tr>
      <th>Fully Loaded</th>
      <td>
        <span style="--data-set:4.9/5;"></span>
        <p>4.9</p>
      </td>
      <td>
        <span style="--data-set:1.6/5;"></span>
        <p>1.6</p>
      </td>
      <td>
        <span style="--data-set:3.3/5;"></span>
        <p>3.3</p>
      </td>
    </tr>
    <tr>
      <th>SEO</th>
      <td>
        <span style="--data-set:4.9/5;"></span>
        <p>4.9</p>
      </td>
      <td>
        <span style="--data-set:2.6/5;"></span>
        <p>2.6</p>
      </td>
      <td>
        <span style="--data-set:2.3/5;"></span>
        <p>2.3</p>
      </td>
    </tr>
  </tbody>
</table>
3. To create a horizontal bar chart, just add the data-layout="horizontal" attribute to the HTML table element and done.
<table data-id="flexbox-bar-graph" data-layout="horizontal">
  ...
</table>
4. Customize the chart by overriding the default color variables:
:root {
  --bar-color-1: #357EC7;
  --bar-color-2: #E42217;
  --bar-color-3: #4CC417;
  --bar-color-4: #7D0541;
  --bar-color-5: #FFD801;
}
Changelog:
06/29/2021
- Set colors of legend and bars together


